Hi – this is Gergely with the monthly, free issue of the Pragmatic Engineer Newsletter. In every issue, I cover challenges at Big Tech and startups through the lens of senior engineers and engineering leaders. If you’ve been forwarded this email, you can subscribe here.
Many subscribers expense this newsletter to their learning and development budget. If you have such a budget, here’san email you could send to your manager.
During April and May, we asked readers of this newsletter about the tools you use in your stack, and your opinions of them. In today’s article, the results are in.
We received more than 3,000 responses to the survey, and after summarily purging the small number of duplicated, automated, and spam ones, there were a total of 2,997 from tech professionals and others. It is this first-hand, primary source information from across the tech industry that forms the basis of the findings in this article.
We’d like to say thanks to everyone who’s provided data; you’ve contributed to what is an exclusive – and hopefully also an enhanced – understanding of the state of tooling, today, based on the highest-ever number of responses to a Pragmatic Engineer survey.
This issue covers:
Demographics
AI tools
Most used, most-loved programming languages
Most hated (and loved) tools
IDEs and terminals
Version control and CI/CD
Cloud providers, IaaS and PaaS
In Part 2, we additionally cover:
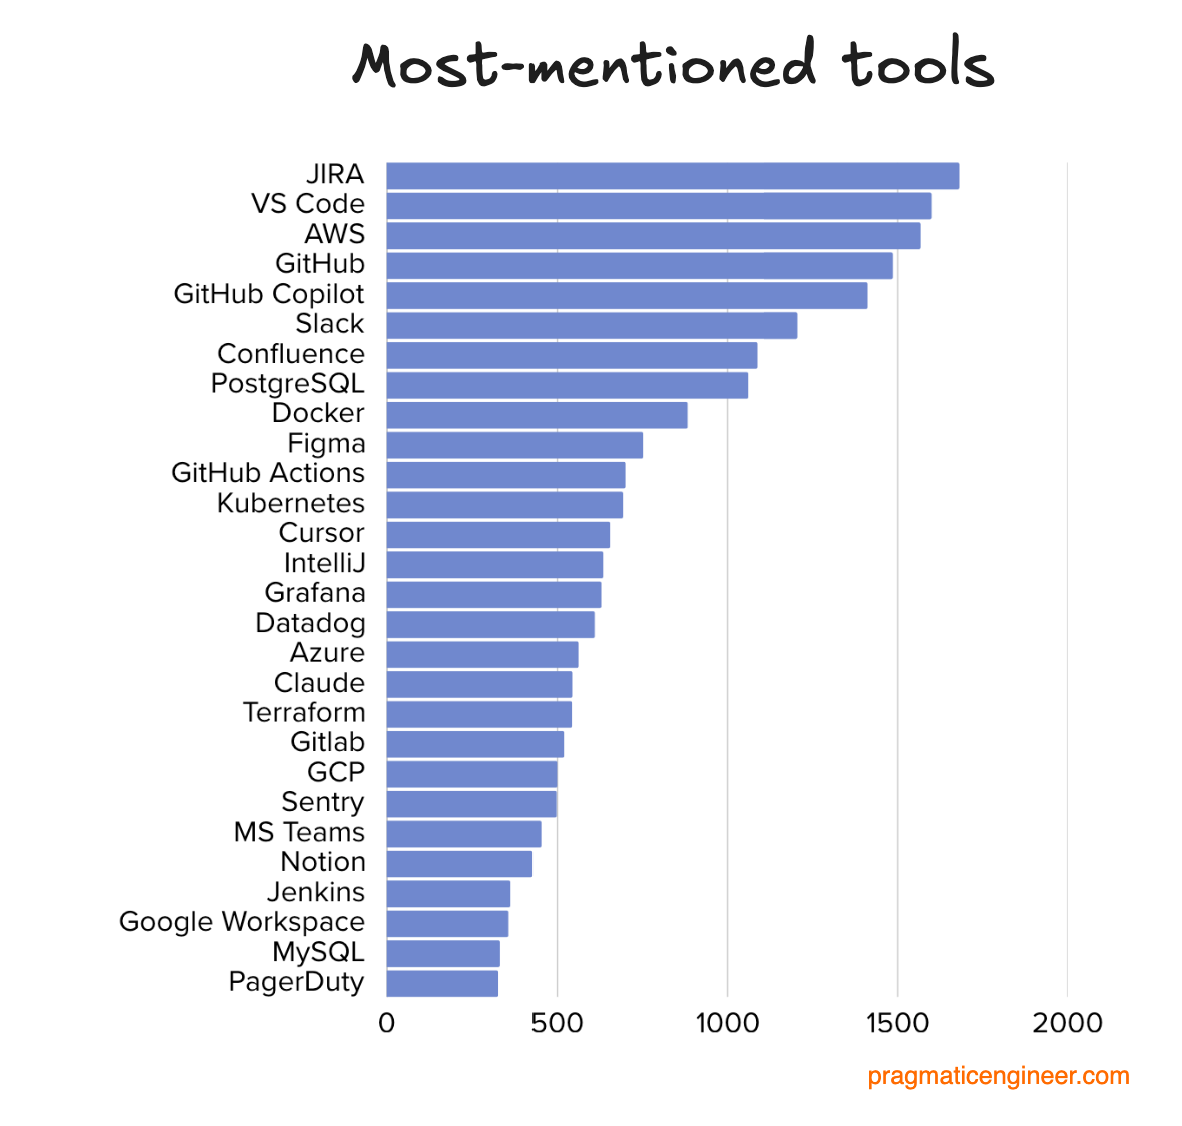
Most-mentioned tools
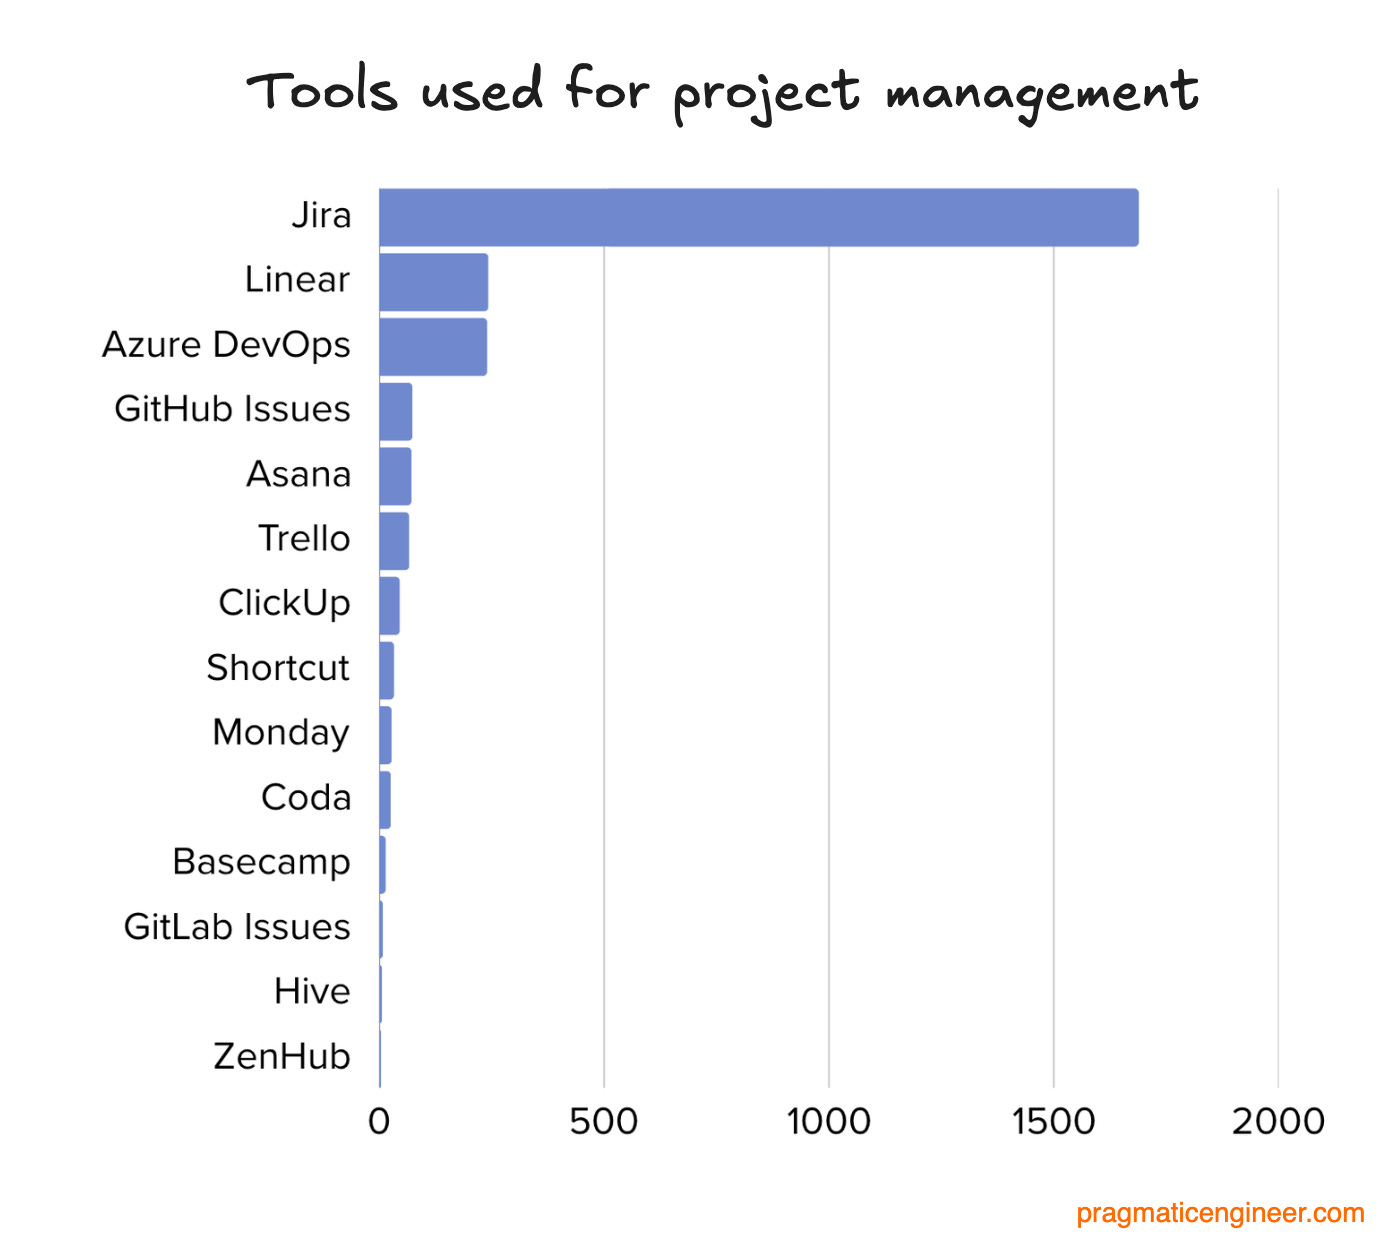
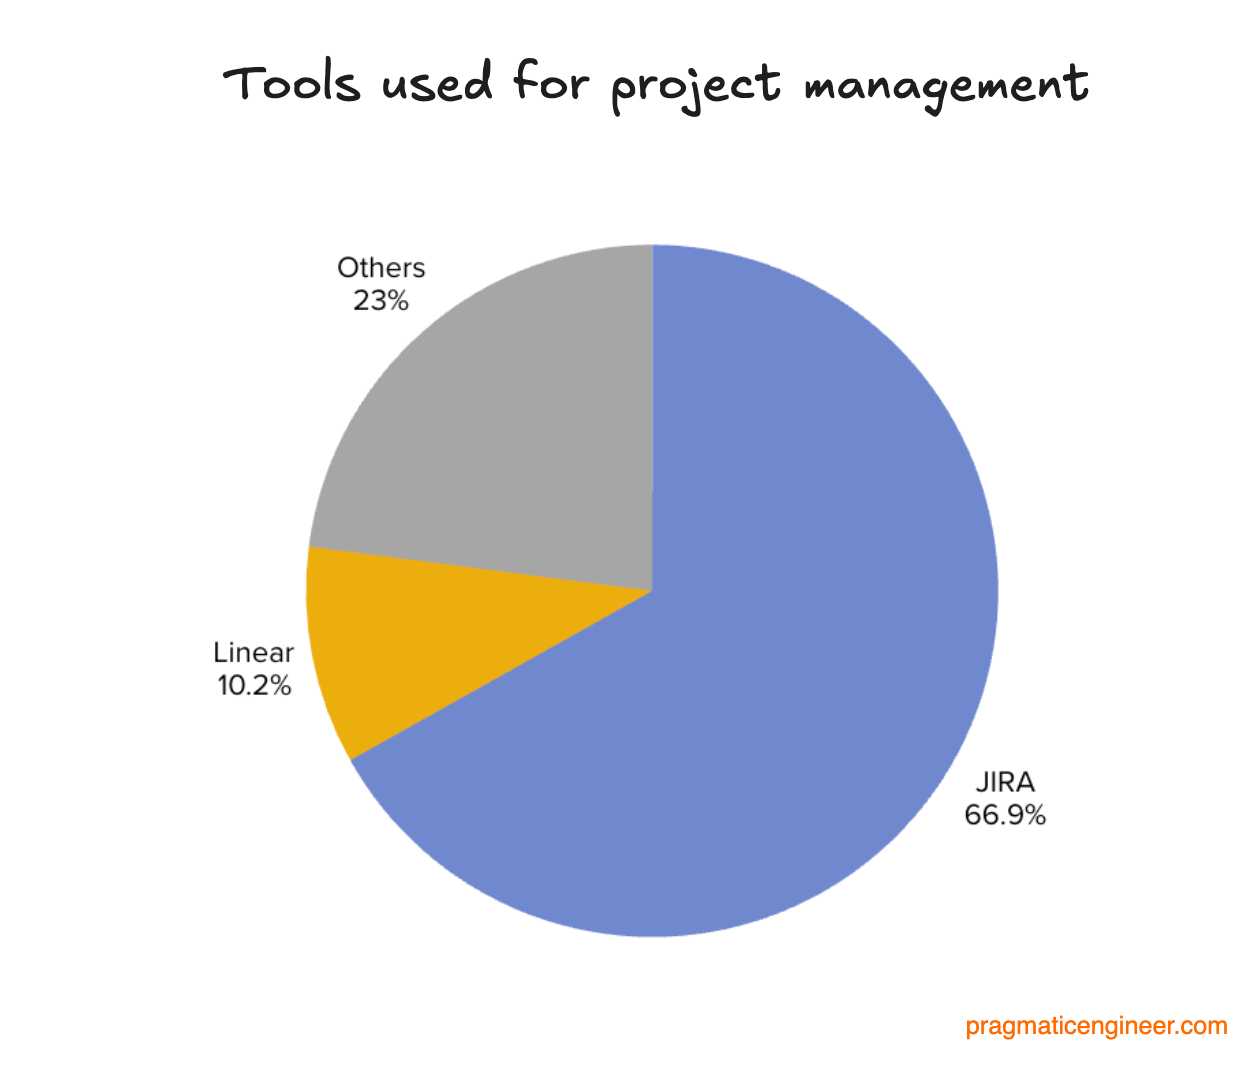
Project management
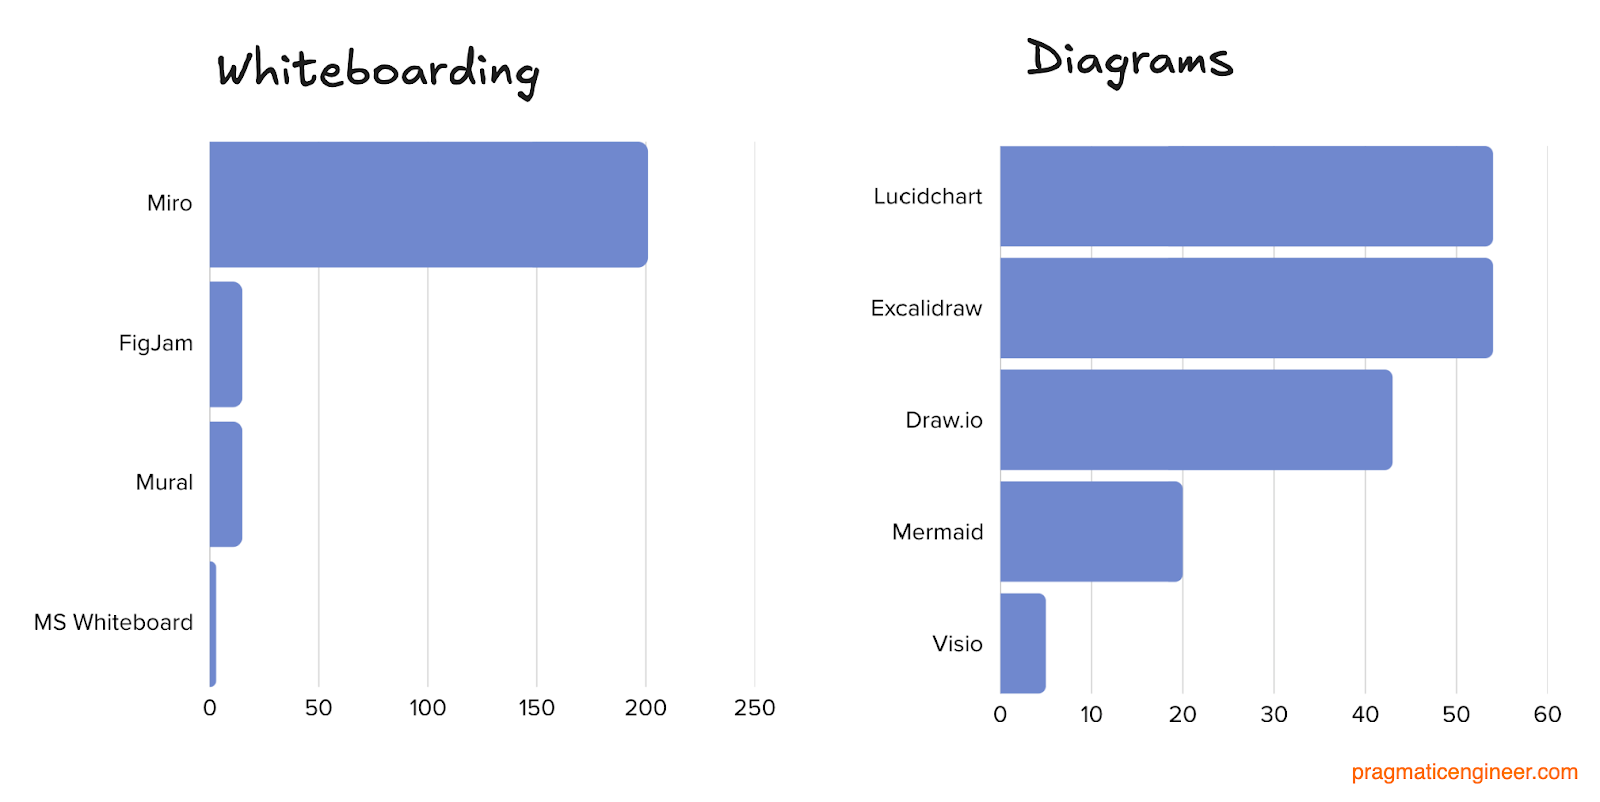
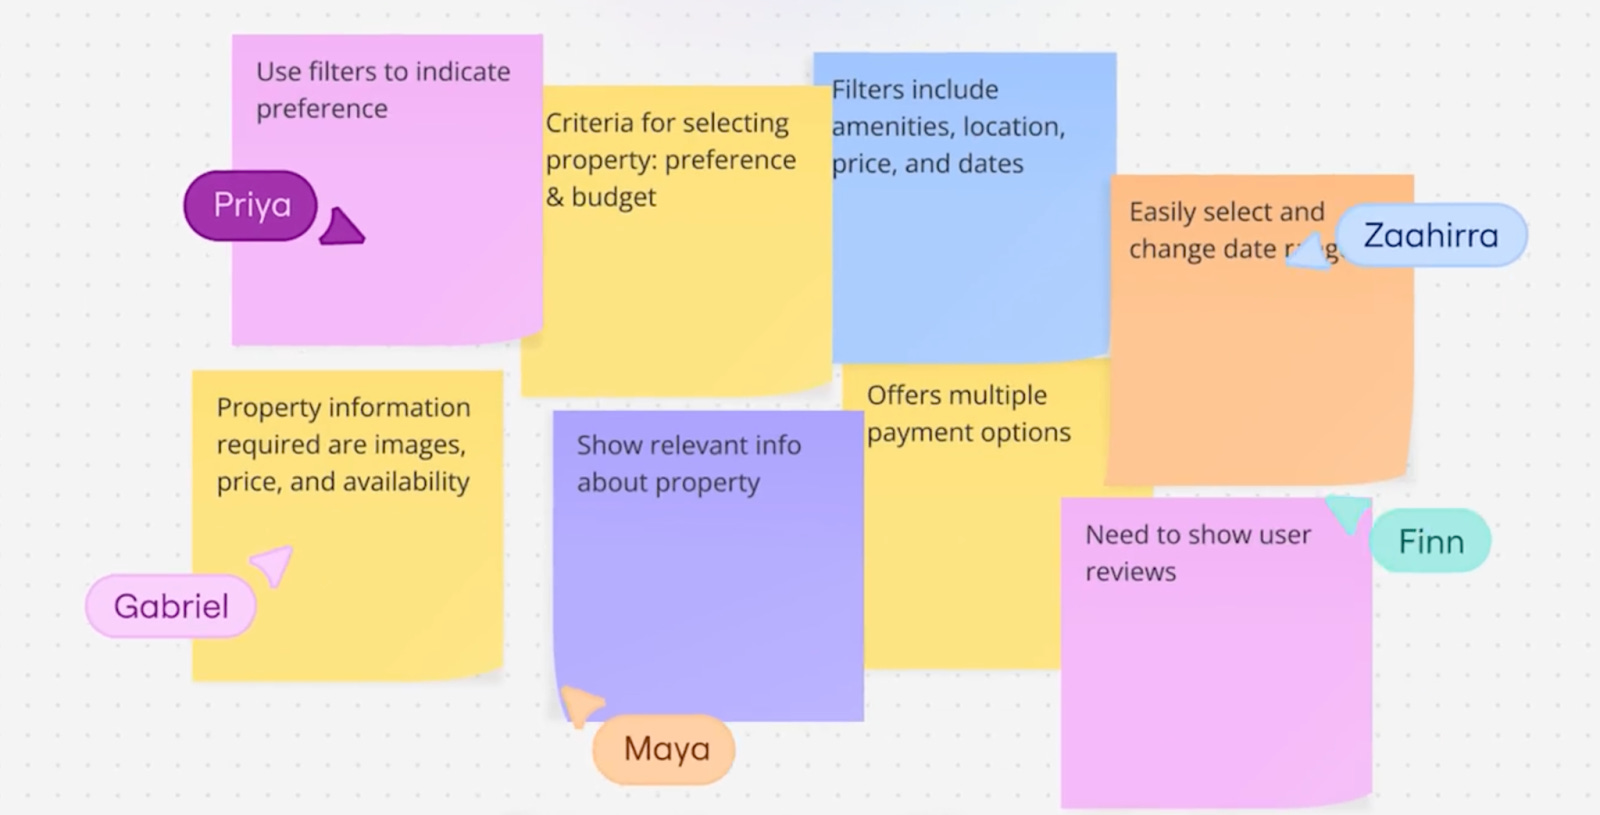
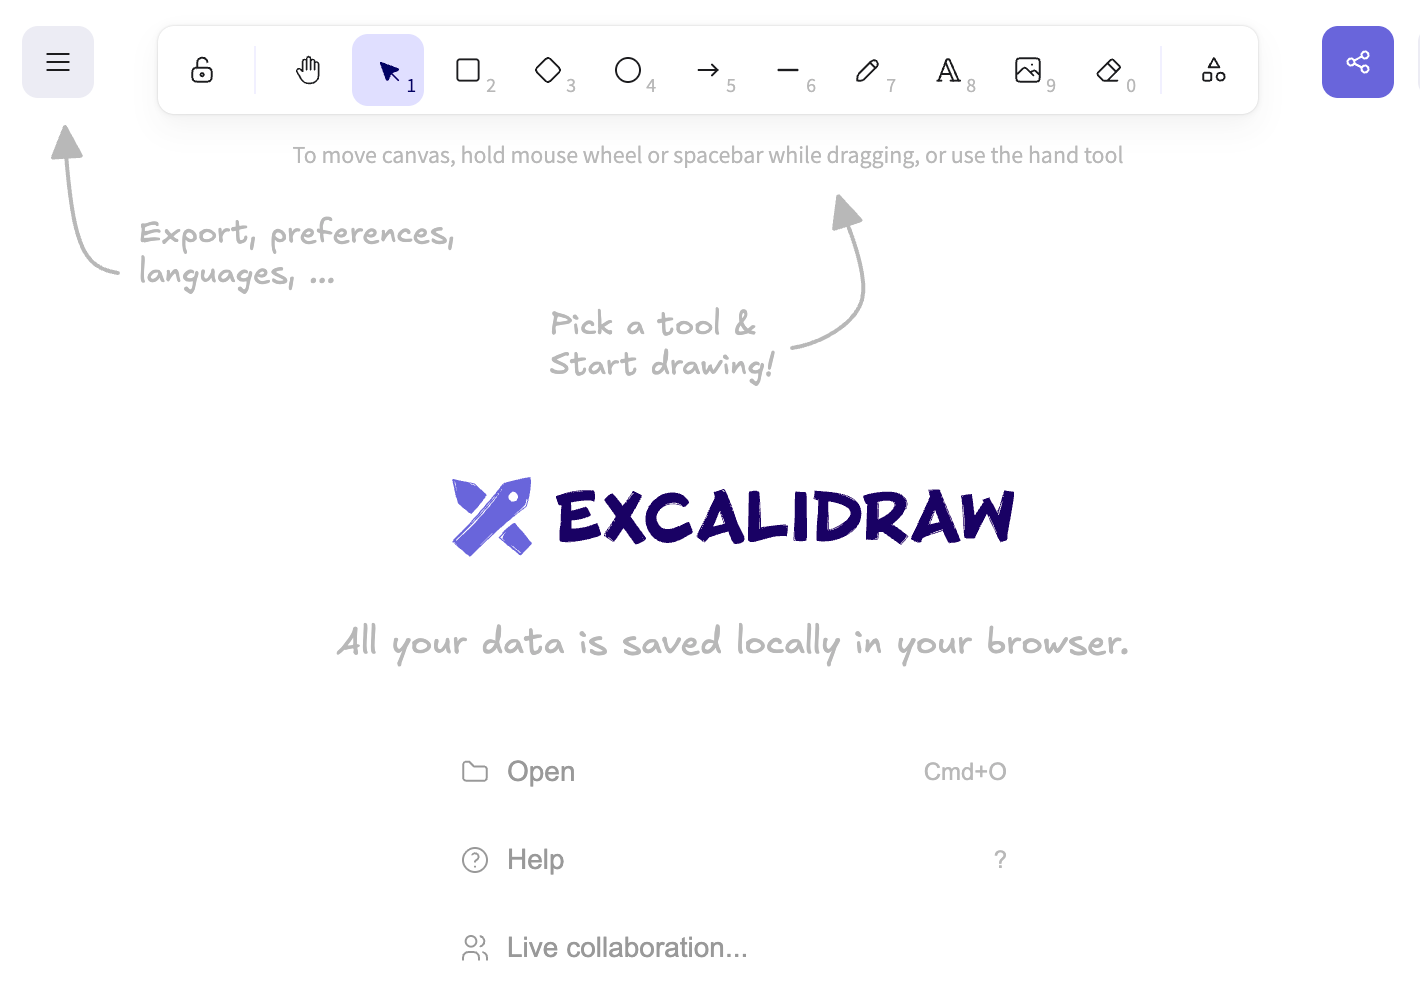
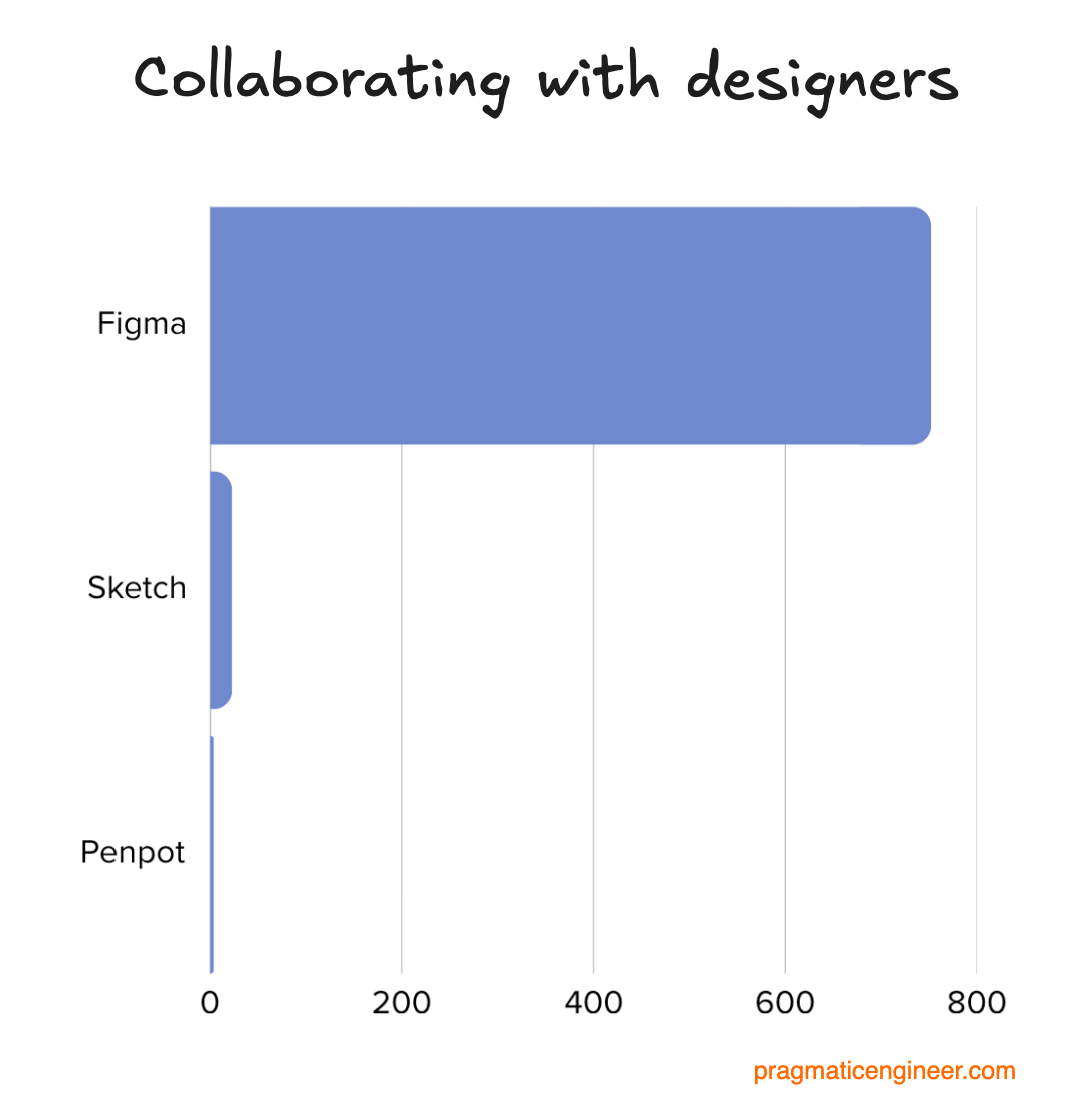
Communication and collaboration
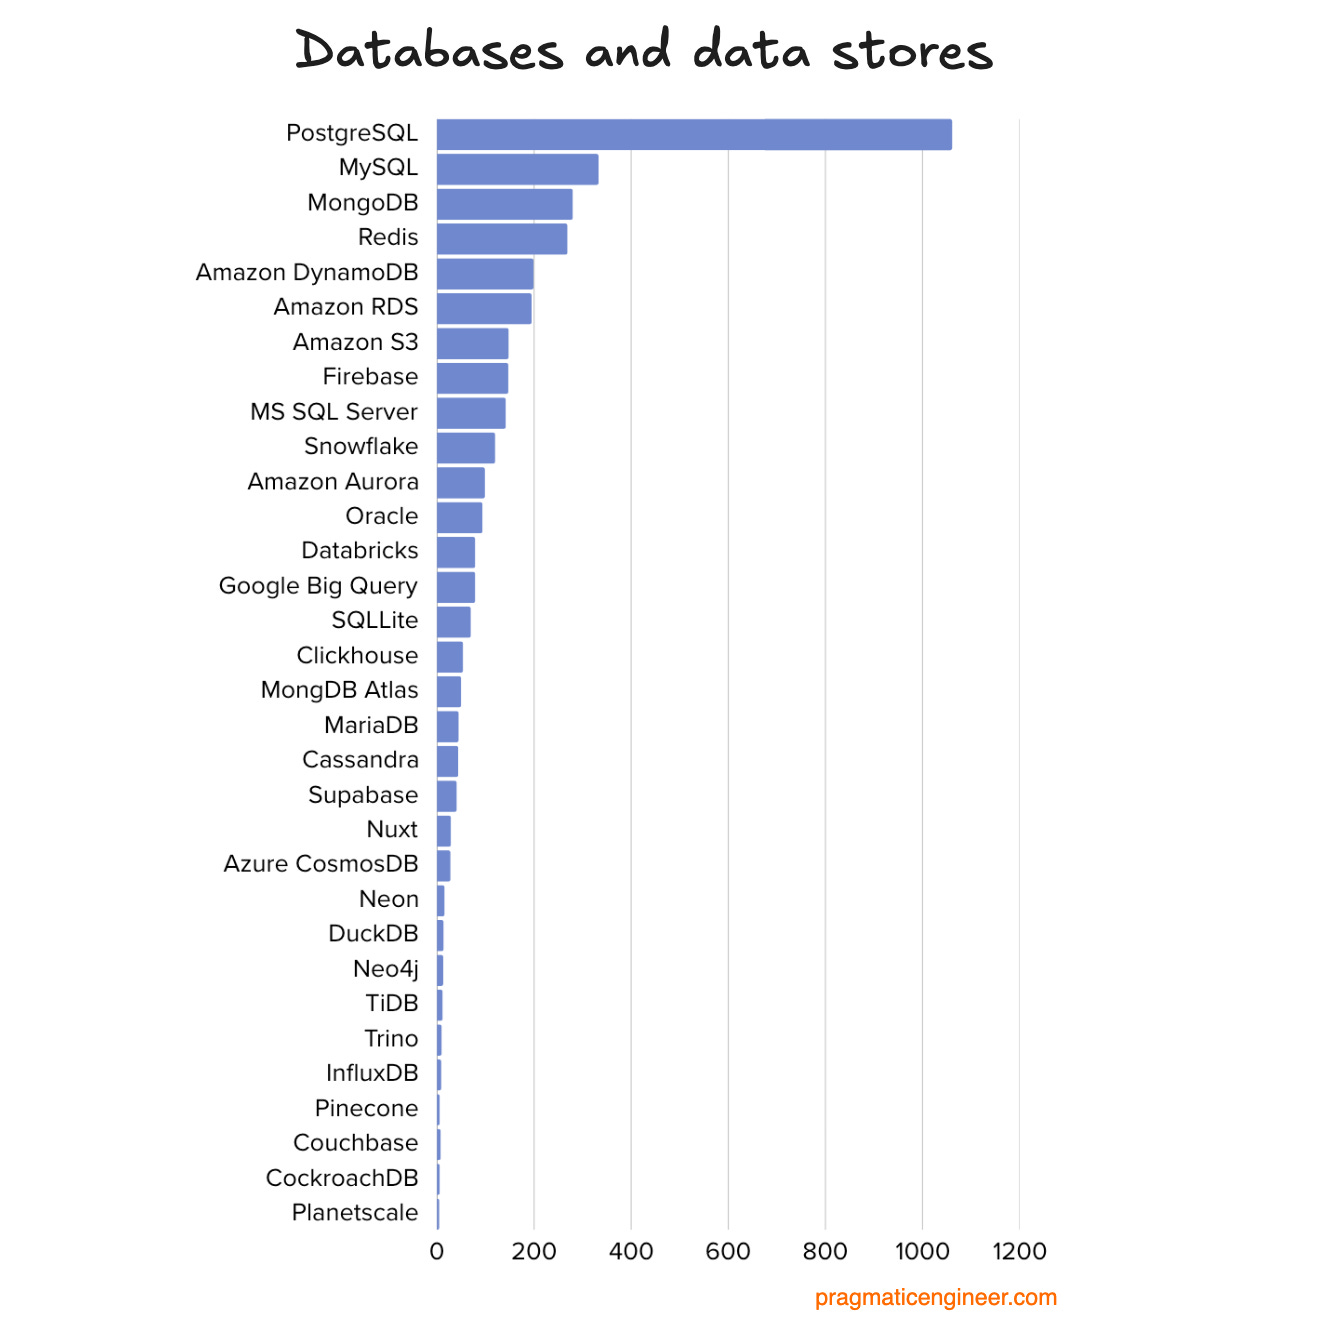
Databases and data stores
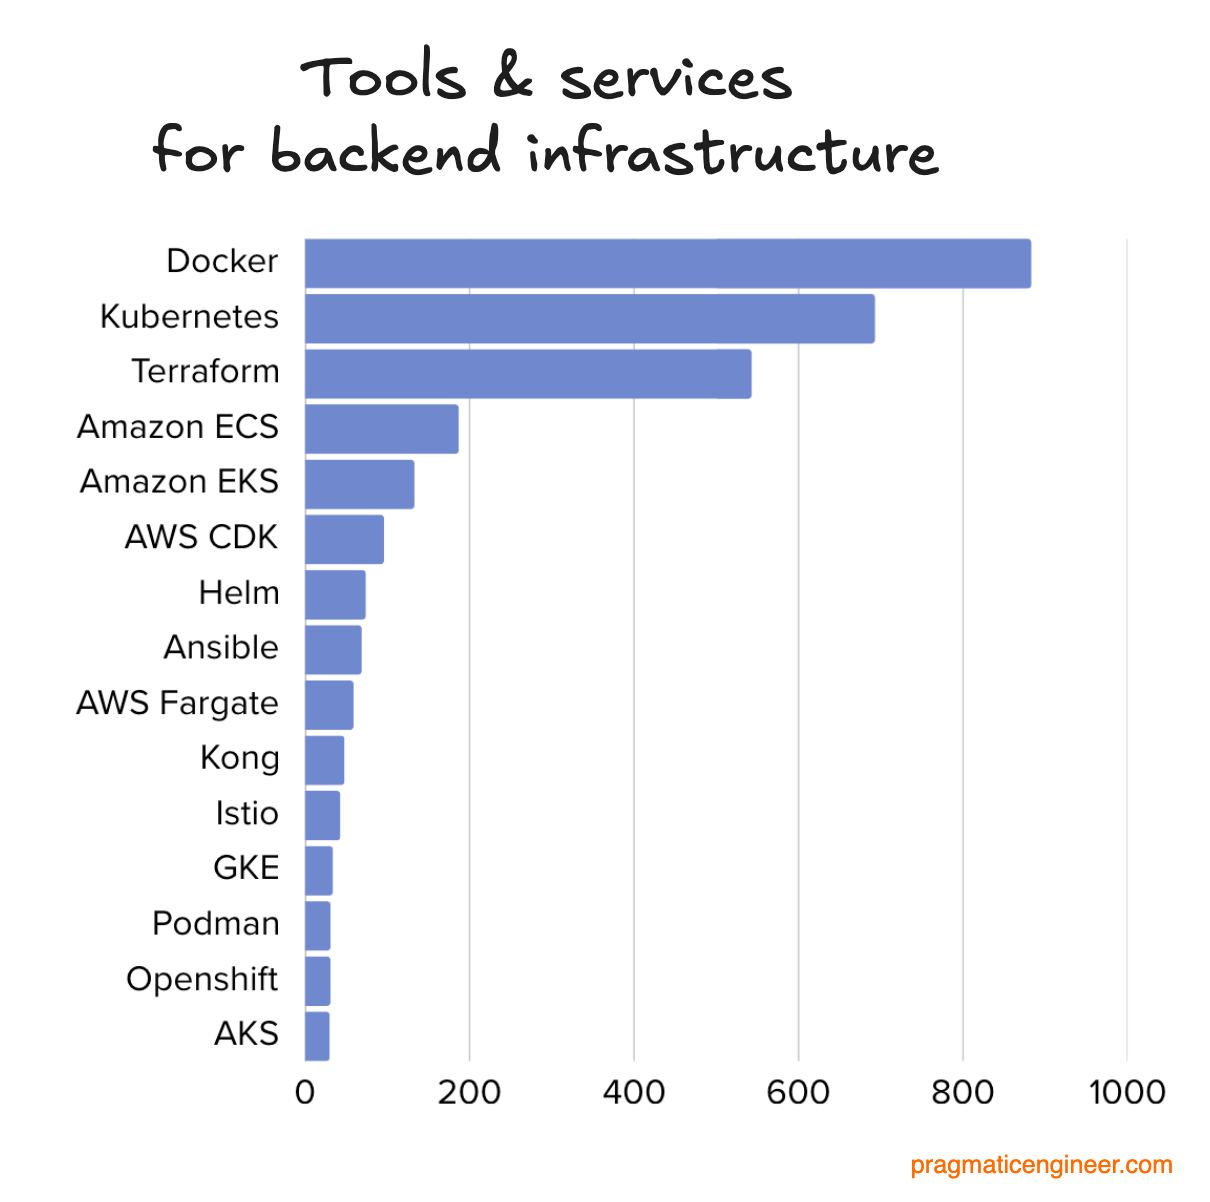
Backend infrastructure
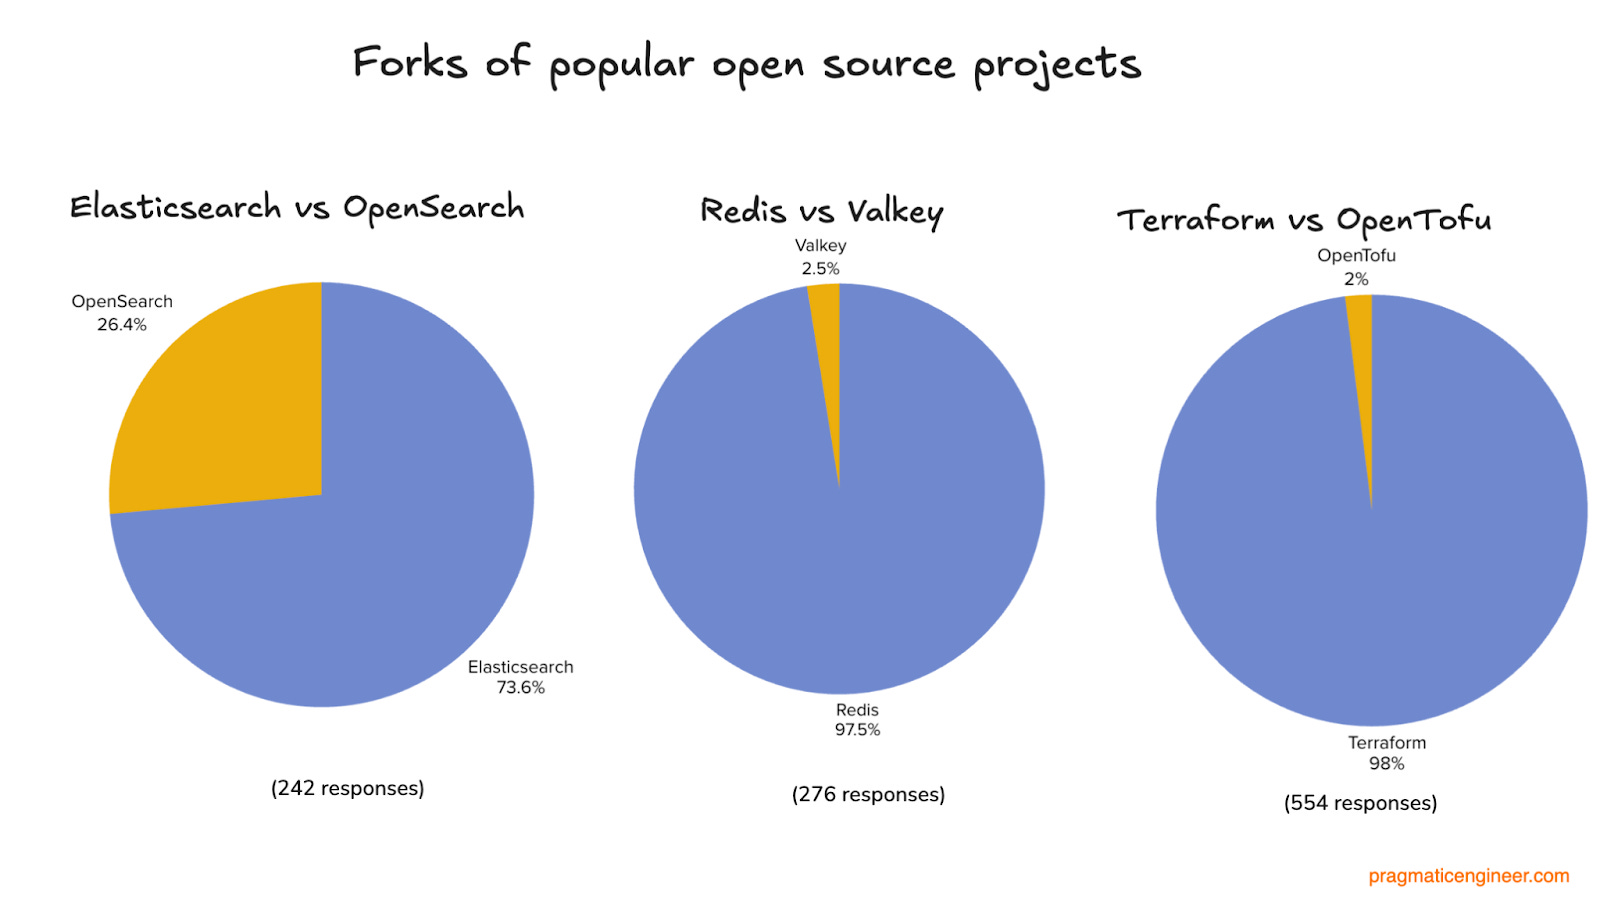
Forks of popular open-source projects
Before we begin: last year, we ran a survey that focused on just AI tooling. Check out the results and analysis in AI tooling for software engineers in 2024: reality check.
1. Demographics
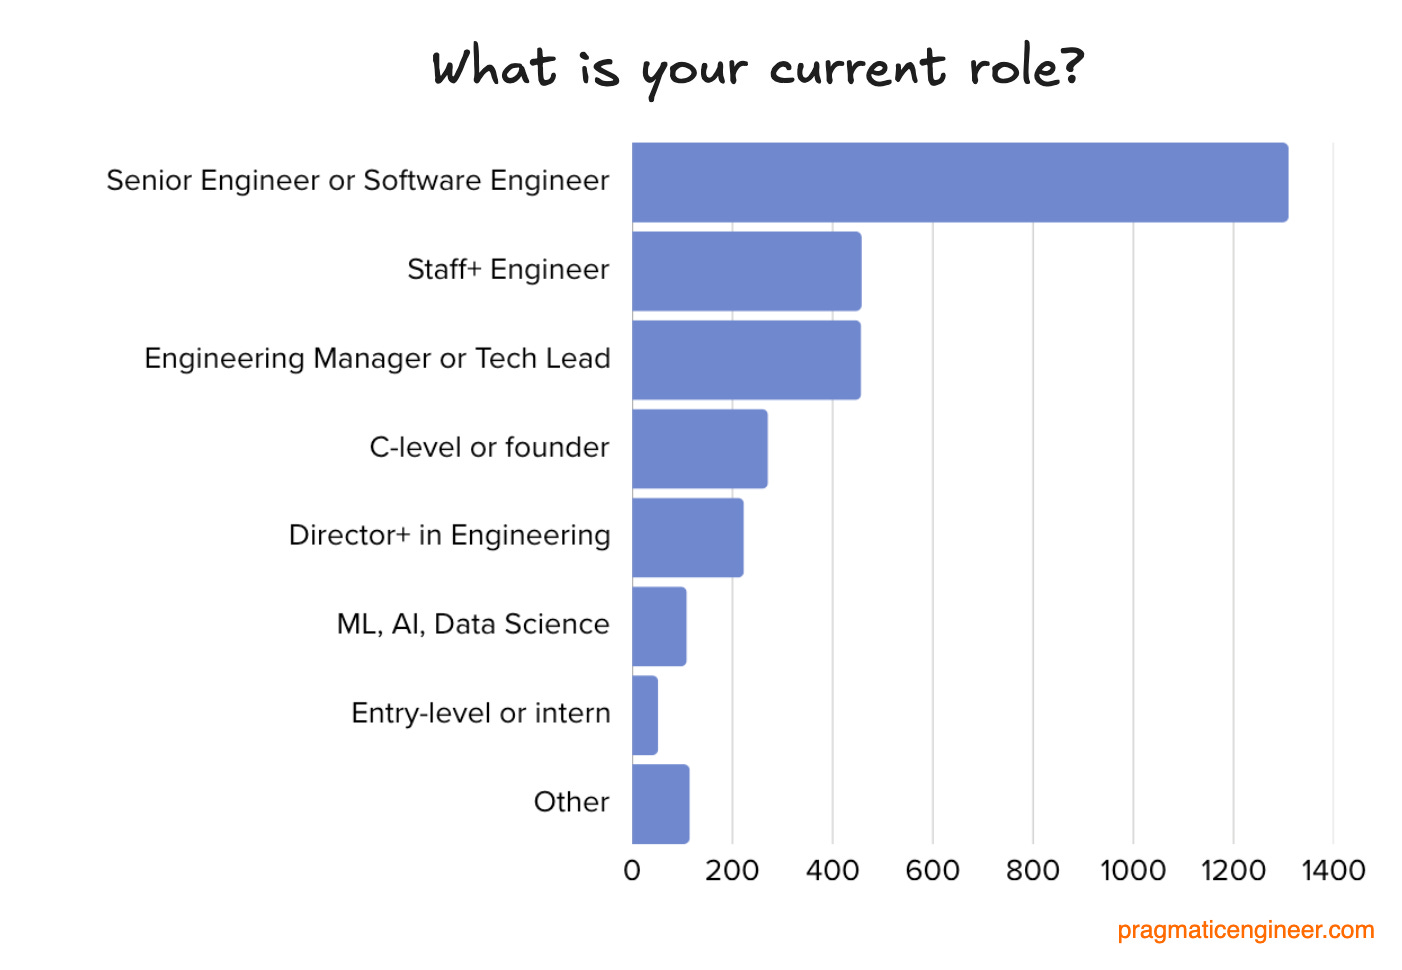
Let’s begin this year’s survey analysis by stating what might be the resoundingly obvious: most people who filled in this tech stack survey are software engineers.
Split by role
Most respondents have been professionals for between 5 and 20 years, and there’s also plenty of seasoned practitioners who have been doing it longer than that, and a similar number of junior folks at the opposite end of the experience spectrum.
Split by years of experience
There’s a roughly even split of people working at tiny, small, mid-sized, large, and huge companies:
Split by size of employer
We asked you what the primary focus of your day-to-day work is, and unsurprisingly, it’s the backend more than anything else:
Split by primary work focus
Based on the data, the “median respondent” in these results is a senior software engineer with 6-10 years of experience, who’s working on the backend stack at a company of any size – from tiny startup to tech giant.
2. AI tools
AI tools are surging in popularity, which is one reason why we’re covering more AI engineering-related topics than ever in The Pragmatic Engineer.
Most respondents mention AI tools. 85% (2,555) mention at least one in the survey. A total of 2,555 people cite at least one AI tool, while 130 say they don’t use them, and 312 don’t mention AI tooling at all.
Split by mentions of AI
Interestingly, four percent (130 people) explicitly do not use any AI tools, either because their workplace forbids it, or they don’t find them helpful, or because of ethical concerns.
Most popular AI tools
AI tools with at least 8 mentions (meaning 0.3% of respondents or more mentioned them) were these:
Answers to the question: “which AI-powered tooling or ‘copilots’ do you use?” (2,997 respondents)
The 9 most-mentioned tools:
The 9 most mentioned AI tools
These results are a little surprising to me for two reasons:
GitHub Copilot (still) wildly popular. In last year’s survey, more developers mentioned using ChatGPT than GitHub Copilot – but now Copilot is the most-used AI tool. Indeed, in this year’s survey, every second respondent says they use this tool. This is a huge number – especially when we consider GitHub Copilot launched only four years ago.
Cursor surging in popularity. Cursor is an AI-powered IDE based on a fork of VS Code. This tool is the second most-mentioned IDE, despite Cursor only launching in 2023. Also, the company has not spent a single dollar on marketing, to date.
Claude gaining a lot of ground compared to ChatGPT. It’s surprising ChatGPT (803 mentions) is not further ahead of Claude (533 mentions). A year ago, in our previous survey, ChatGPT had 8x as many mentions as Claude, but that’s changed. Anthropic’s release of Sonnet 3.5, 3.7, and 4.0 – which excel at coding – are one reason for its popularity among techies.
Claude Code had momentum before it was even released. This survey closed at the end of May, and Claude Code was released on 22 May. So most respondents had likely only used Claude Code via the waitlist, on the private beta. To rack up so many mentions before the official release suggests good early traction for Claude Code, which has boomed in popularity in the weeks since the survey closed.
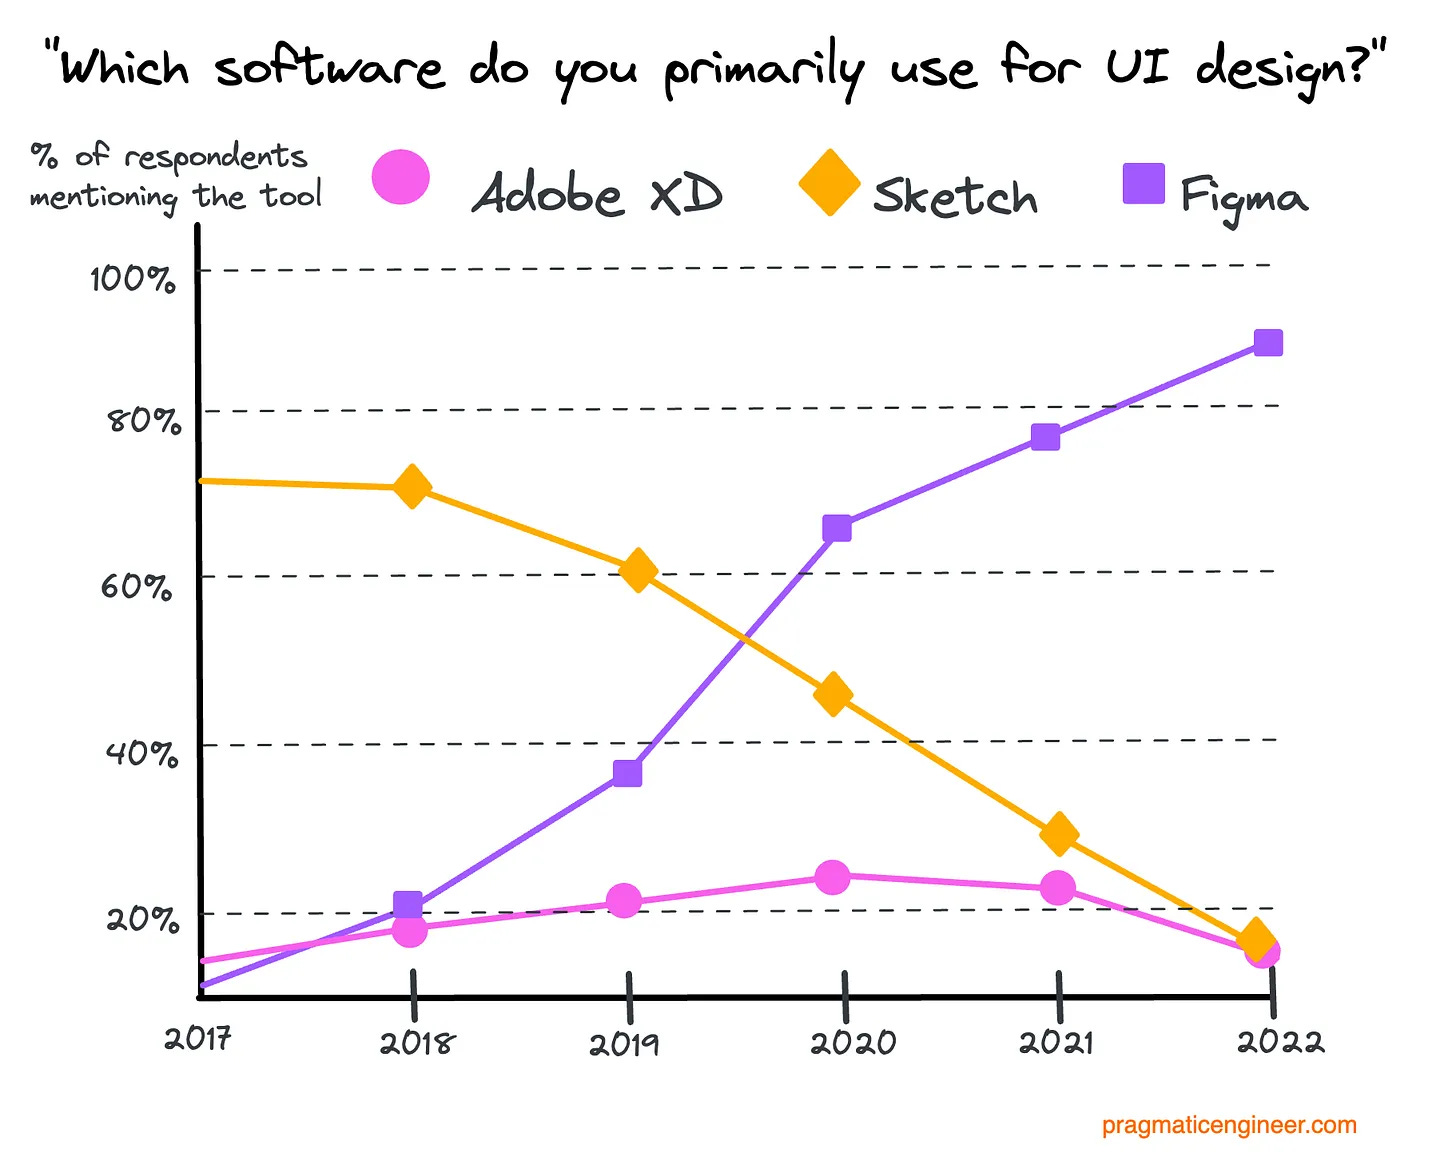
Are newer AI IDEs “overrepresented” in social media vs usage across the industry? In November of last year we ran a survey on IDEs with AI features that developers love - collecting answers only over social media. Back then, Cursor came out as the leading answer, slightly behind of GitHub Copilot:
Cursor, Zed, Windsurf and other new IDEs getting a larger share of social media mentions than their usage across the industry?
In the article, I added the disclaimer that we’re likely seeing leading indicators at most, and some of the tools mentioned might not go mainstream:
“Data from early adopters tends to indicate where innovation is within tooling. However, many tools which early adopters use never go mainstream, often because status-quo vendors adapt their tooling for customers before new competitors can take too many customers. In this case, “mainstream” IDEs are Visual Studio, Visual Studio Code, and JetBrains IDEs.”
GitHub Copilot and ChatGPT usage seem to be dropping, and competitors growing. Here is how mentions compare between last year’s AI tooling survey (concluded in April 2024) and this year’s reader survey:
Change in survey responses, a year apart. Copilot and ChatGPT drop, while Cursor and Claude surge
AI search engine Perplexity is mentioned about as often as it was last year, with around 4% of respondents using it. As a note, annual subscribers of The Pragmatic Engineer get a year-long free trial of Perplexity. They don’t pay me for this endorsement: I set up this collaboration with Perplexity because I’ve been impressed with it, and am happy to help others discover this tool. We previously covered how Perplexity and Kagi are taking on Google.
AI tools by company size
How are the tools mentioned above actually used in workplaces of different sizes? Perplexity aside, the results are very interesting:
Split of tool mentions, by company size. Sample size: 430-760 respondents per category. Respondents could mention multiple tools
Interesting findings from mentions of AI tools by company size:
The larger the company, the more likely it is that devs use GitHub Copilot. With the exception of “huge” (10,000+ people) places, the larger the company, the more that GitHub Copilot adoption is reported. If you want to use GitHub Copilot day-to-day, your best bet might be to join a large company!
The smaller the company, it’s more likely that people use Cursor, Zed, or another AI IDE. More devs in smaller workplaces mention Cursor, ChatGPT, Claude, and Zed – likely instead of Copilot. This trend is also present with the likes of Windsurf, Claude Code, and other alternative IDEs. I wonder if this might be because smaller startups have laxer policies for AI tool usage (i.e: “use whatever you want”), while larger companies use tools supplied by enterprise vendors. Nowhere is better at selling enterprise contracts than Microsoft is (GitHub).
The smaller the company, the more likely that ChatGPT and Claude are used. This was a bit of a surprising finding, too. As above, one possibility is that larger companies are stricter about access to AI tools, and so maybe devs have just the in-house AI tool to use. For example, at Amazon a developer told me that ChatGPT and other third-party LLMs are banned, and only LLMs like Amazon Q, and the internally hosted Claude, are allowed.
Gemini is the only tool for which company size seems irrelevant. Gemini is mentioned by only around 8% of respondents from the largest of companies (10,000+ people) to the smallest (50 or less). This is very curious: why are some models popular with small companies, but not Google’s?
My two guesses are:
Some Gemini usage is reported by respondents whose employer has access to Google Workspace, with which Gemini comes bundled. Around 12% of respondents mention having access to Google Workspace – and if a subset of them use Gemini, then 8% checks out.
Some more Gemini usage could be coming from Android developers. As a software engineer shared in the survey: "Android folks make use of Gemini, but are starting to look into Firebender (‘the Cursor for Android Studio’)."
If you have another theory, please leave a comment!
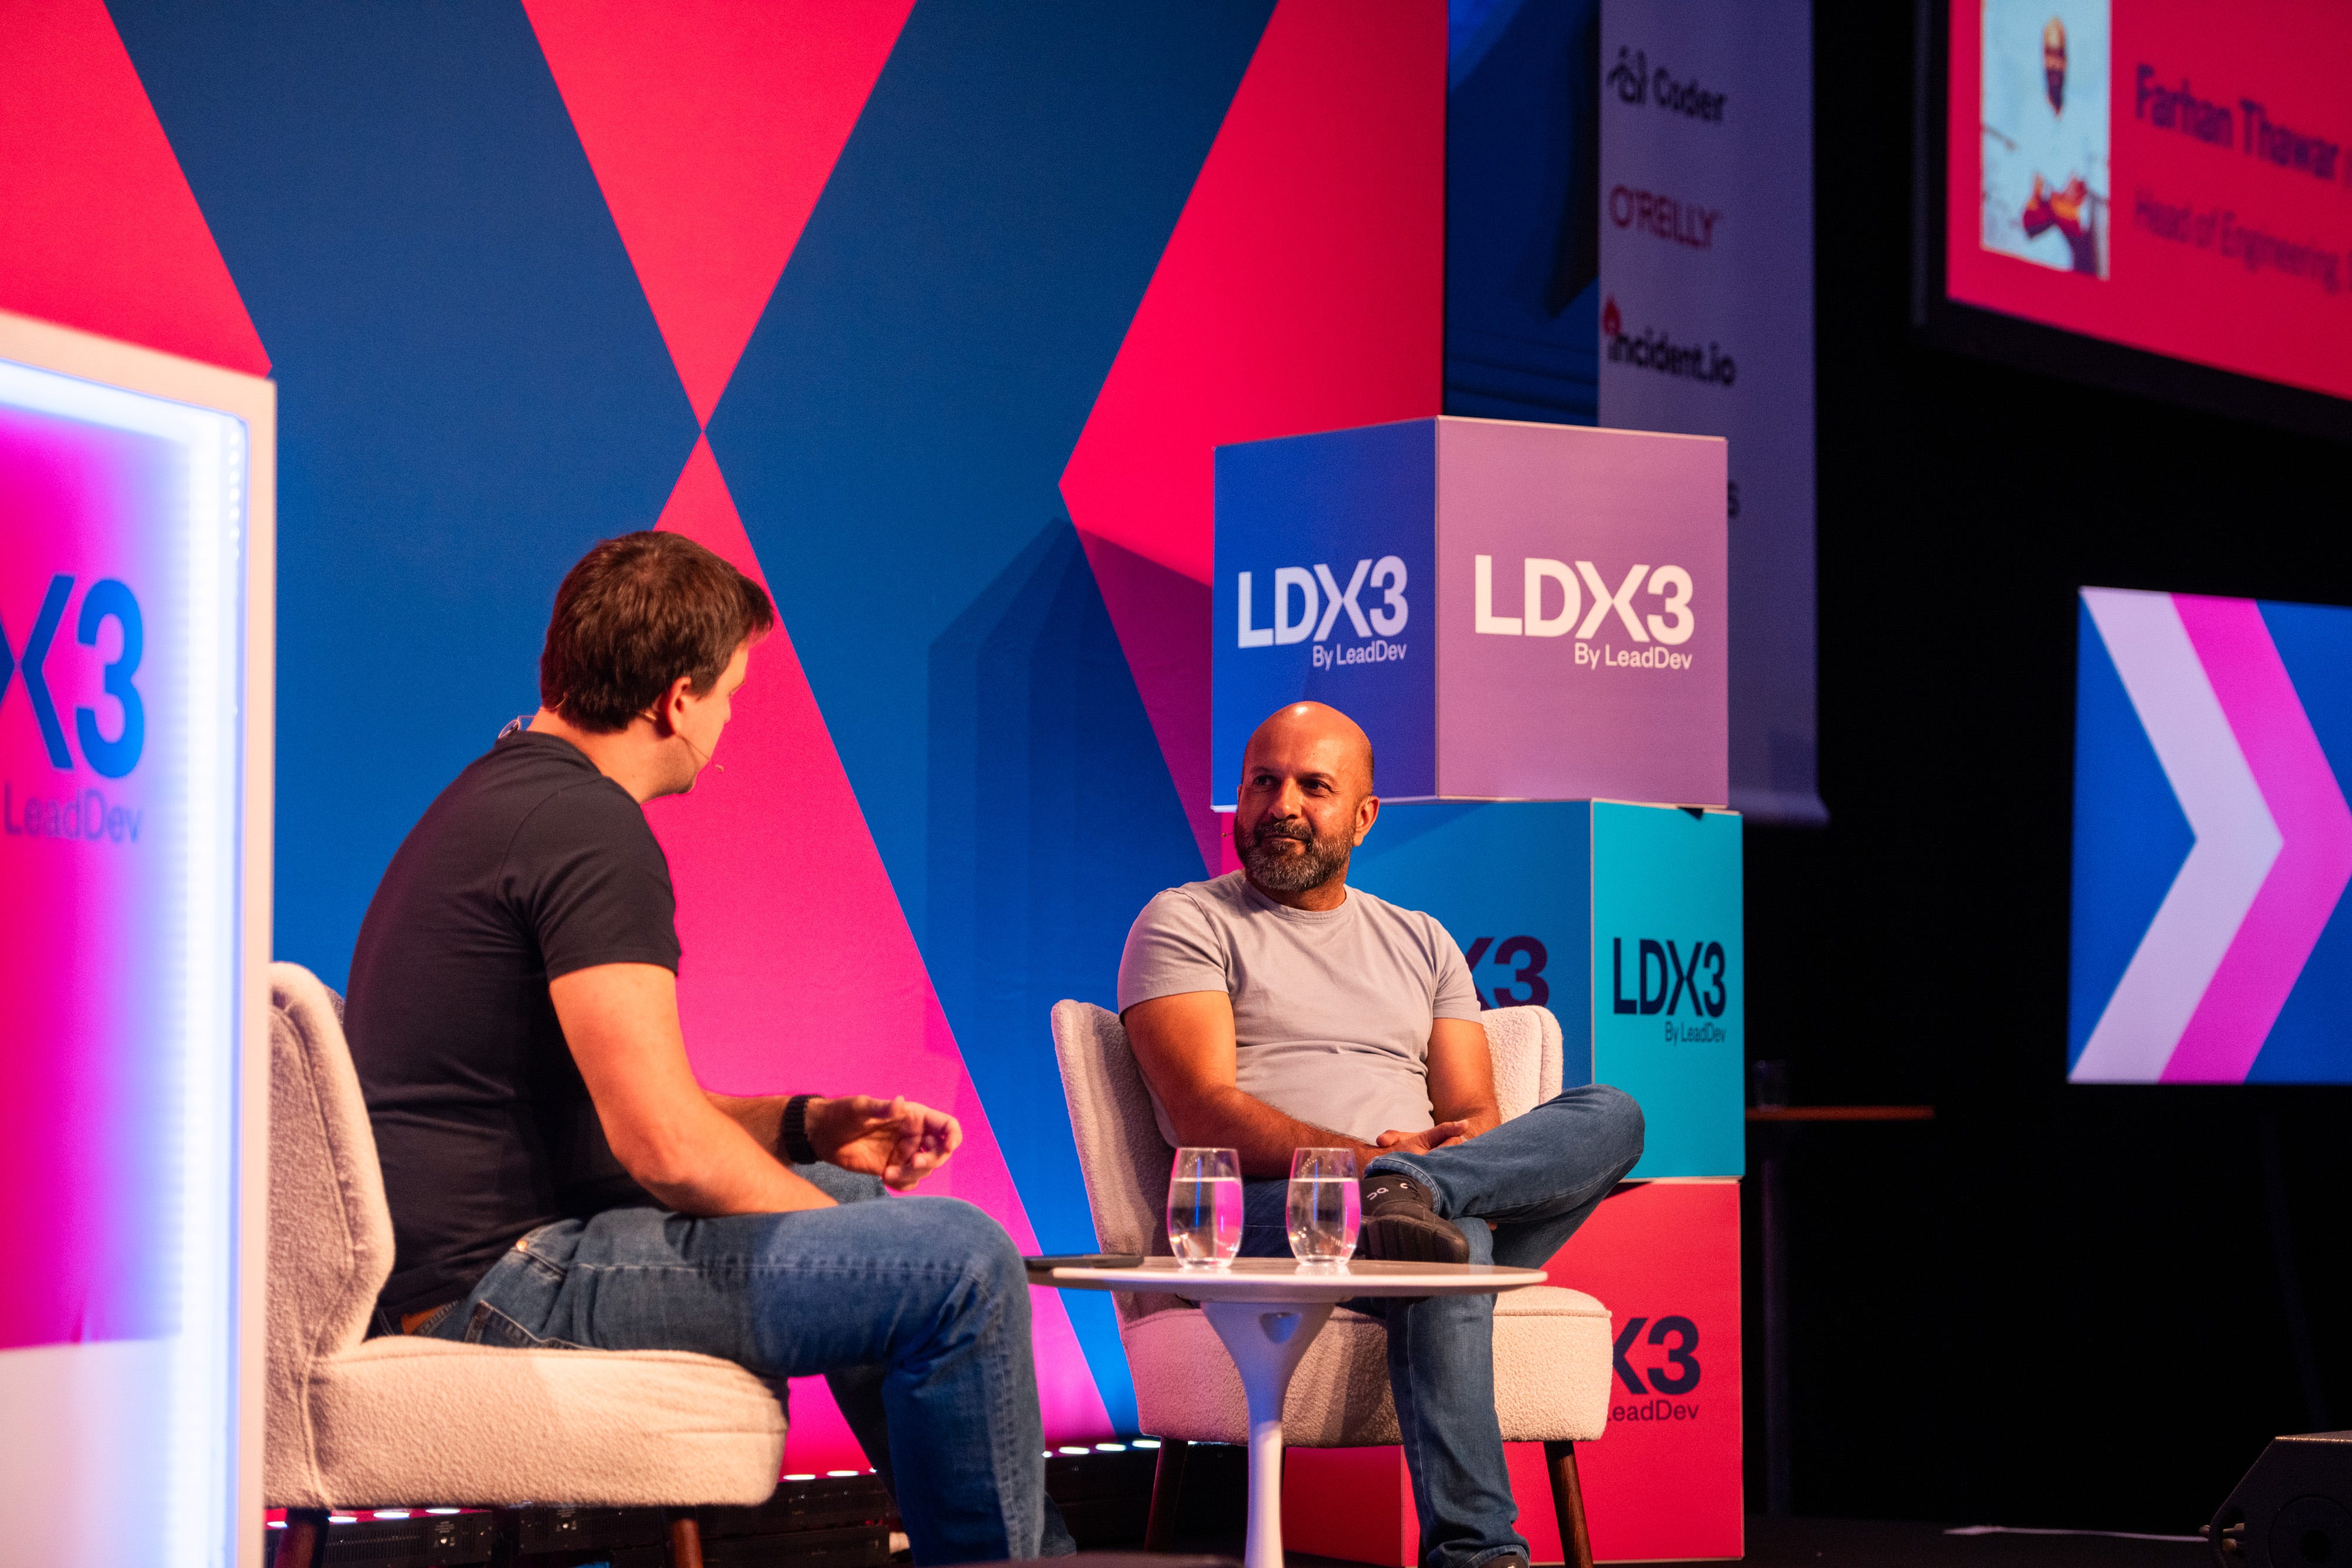
The bigger the company, the more likely it is that devs only use one AI tool. Among all companies, the “average” respondent mentions more than one tool, except at huge places with workforces of 10,000+. This suggests the biggest companies might have the strictest policies on use of tools and allow only one. In the podcast episode with Shopify’s Head of Engineering, Farhan Thawar, he shared how Shopify used to have this policy, and recently changed it in order to experiment with more AI tools.
Other AI tools
Some lower-profile AI tools are also mentioned by respondents in the full results. In descending order by number of mentions:
More AI tools, by number of mentions
The tools listed:
Microsoft Copilot: Microsoft’s chatbot. Not to be confused with GitHub Copilot, although Microsoft sure does help confuse things by using such a similar name to the more popular coding copilot.
DeepSeek: the open LLM created by a small team in China that lapped even the best LLMs back in January when it was released. We cover more in DeepSeek rocks the tech industry.
Warp: an AI-powered terminal. The startup was founded in 2020 and has raised $73M in funding since.
Graphite: an “AI developer productivity platform.” The company started as a solution for stacked diffs and has expanded into pull request (PR) review, and helping teams ship faster. Founded in 2020, the startup raised $81M in funding. We cover more in Stacked Diffs (and why you should know about them), and also in Stacked diffs and tooling at Meta (note: I’m an investor in Graphite).
JetBrains AI: AI assistants built into JetBrains IDEs. Interestingly, across all responses, most developers using JetBrains IDEs seem to use other AI tools that integrate into JetBrains IDEs – most notably, GitHub Copilot.
Cody by Sourcegraph: an AI assistant that integrates into the most popular IDEs.
Amazon Q Developer: Amazon’s AI-powered assistants. Within the online retail giant, usage is strongly encouraged, and most devs do use it. The AI is particularly good with AWS APIs, and working with the AWS command line interface (AWS CLI).
Ollama: run LLMs locally, such as DeepSeek and Llama.
Aider: AI pair programming inside a terminal.
Cline: an open source “collaborative AI” assistant, with access to frontier models. You select the models to use, and pay via a Cline account.
Grok: the large language model built by X.ai.
Vercel v0: a “vibe coding tool” built by Vercel. Most usage is for prototyping and throwaway mockups. One founding engineer at a seed-stage startup shares: “we’ve almost replaced all our Figma usage with one-off v0 mockups.”
Raycast: an app launcher for MacOS (a “command center”) that comes with additional AI features for Pro users (use natural language and LLMs to get work done with apps already on your machine). In the responses, Raycast has 14 mentions, while Raycast AI 4 mentions. Many devs seem to use Raycast to launch AI tools or improve their workflow that includes AI tools, so we grouped all mentions for this one tool.
Tabnine: the AI assistant that entered the market years before any other tool. It launched in 2019, two years before GitHub Copilot. With much more competition six years later, it’s tough for this first entrant to stand out.
Mistral: an open, free to use, LLM built by the best-known European foundational models company.
Augment Code: an AI software development platform optimized for larger codebases.
Coderabbit: AI-powered code reviews.
Bolt.new: a “vibe coding” tool with impressive growth rate: the tool went from $0 to $40M in annual recurring revenue (ARR) in 5 months time (!) and crossed 6 million users (!!), CEO Eric Simons told me. Eric told me that the tool is primarily used by non-devs (PMs, designers and others) — so it’s no wonder that uptake is lower in this group.
Lovable: one of the most popular “vibe coding tools” across non-developers. The startup went from zero to $40M annual recurring revenue (ARR) also in 5 months’ time, by April 2025, and claims to have more than 1M users. As with Bolt, this surge in popularity is likely coming from non-developers.
Devin: an AI agent called “Devin, the AI software engineer” which markets itself as “crush your backlog with your personal AI engineering team.” The positioning of this tool is that it can replace software engineers; understandably, this doesn’t make it too popular with devs.
Junie by JetBrains: an AI coding agent
Replit: a vibe coding tool surging in popularity: its annual recurring revenue (ARR) increased from $10M to $100M from January to June 2025. As with Bolt and Lovable, the surge is most definitely coming from non-software engineers using it.
A few interesting observations from this list and the responses:
Most respondents who mention vibe coding tools aren’t engineers. Around two thirds of those who mention Vercel v0, Bolt.new, and Lovable, are founders, director+ folks, or engineering leads. Of the remaining third, half are staff+ engineers, and the rest software engineers. This suggests that vibe coding tools might be more helpful for less hands-on folks who want to prototype something, perhaps to show to their engineering team.
Devin is not popular with developers – but Windsurf is, so is this why Cognition is buying Windsurf? It was reported yesterday (14 July), that Cognition, the company behind Devin, is acquiring Windsurf. The story so far is a bit messy:
OpenAI made an offer to acquire Windsurf for $3B in May
The deal fell through – likely because Microsoft (an investor in OpenAI, owning 49% of the company) and OpenAI were unable to agree on the IP rights about Windsurf post-acquisition (as per terms, Microsoft owns all IP in OpenAI)
Google then announced it was “buying out” Windsurf’s core team for $2.4B, and all founders and core Windsurf employees quit for Google with payouts, while Windsurf investors were made whole. The staff from Windsurf works on Gemini
Windsurf is left with $100M of cash in hand, and the employees who didn’t quit for Google.
The deal is unusual but does fit a trend of Big Tech shunning normal-style acquisitions in order to avoid disruptive governmental antitrust investigations. Google gets the people it wants, without a product it doesn’t want (Windsurf), and leaves the company technically operational. But Windsurf is now effectively a “zombie” company, with some staff and funding left, but potentially a declining userbase, after the founding team all jumped ship.
Following that, Cognition stepped in to acquire Windsurf. Our survey shows that Devin has about 10% of the usage as Windsurf has respondents (and 1% of usage than Cursor has with devs), so could the creator of Devin buying Windsurf be Cognition’s attempt to gain more developer traction? Cognition was founded in 2023, raised $200M to date, and was valued close to $4B in their last funding round.
Devin has been positioned for founders as a way to replace developers with an “AI Engineer” that costs approximately $500/month. We previously analyzed why Devin likely needed to position itself like this to gain market share. At the same time, it was revealed Devin faked its launch demo by pretending to “complete real jobs on Upwork” which it didn’t do. The company has not yet corrected its inaccurate statements.
My two cents is that a company like Cognition cannot have it both ways: it cannot market itself as an “AI software engineer” that replaces devs, but also wants developers to use this tool. It should choose one direction, though my sense is that Cognition will keep marketing itself as a replacement for human developers.
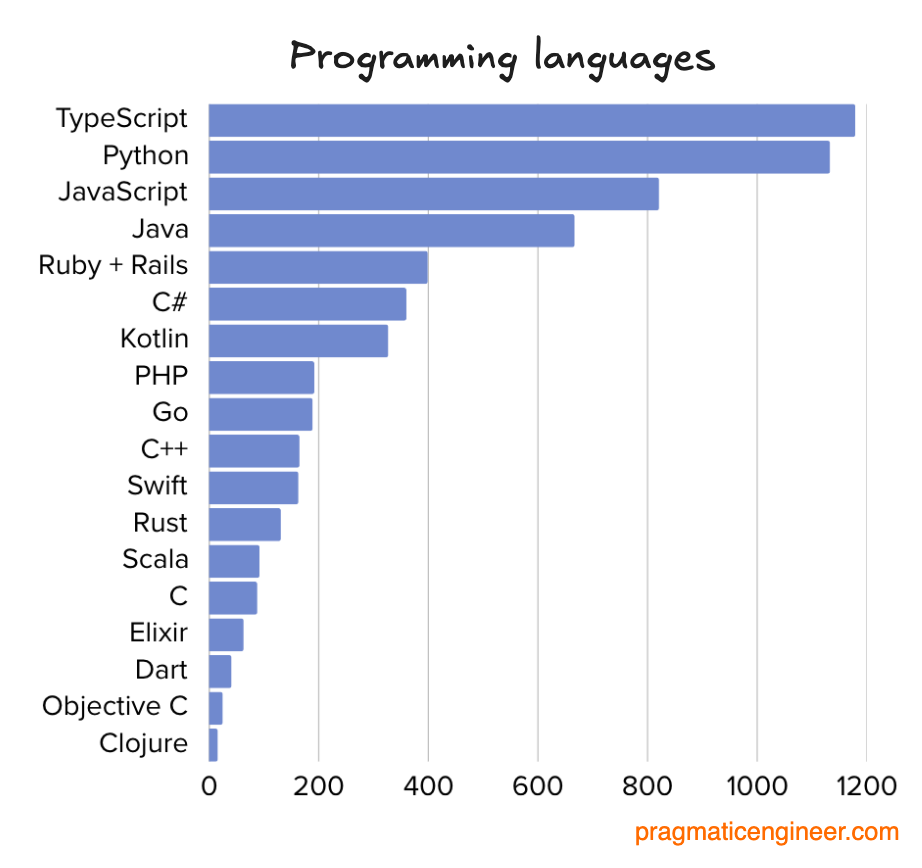
3. Most used, most-loved programming languages Most-used languages
The most frequently mentioned programming languages:
The 18 most-mentioned programming languages
TypeScript being the most-used is less of a surprise these days: it’s a type-safe language that can be deployed on both the front and backend. Engineering teams at Linear and Bluesky share that this is why they use it.
Python seems to me like it’s having something of a renaissance. Not only is it an expressive, powerful language, but it’s the “shared language of choice” among software engineers, data scientists, and ML/AI engineers.
Swift has clearly become the default language choice for those building native iOS applications, with 6x as many mentions than Objective C. It’s been 11 years since the language was publicly announced in 2014, and my guess is that most iOS engineers working with Objective C are likely doing so on legacy codebases, where a rewrite is not worth the effort.
Most-loved languages
Gathering this data was a little tricky because answers are shared with us in “freeform,” meaning we have to interpret each response, such as “I don’t really like JavaScript: I could use Python instead.” In this example sentence, “JavaScript” is disliked, and “Python” is loved. We did our best to count all positive and negative mentions. Here’s the top 10:
This table is pretty predictable, except perhaps for how much love there is for Ruby on Rails. The language is the 5th most popular in usage, and the 3rd most loved one. Elixir being the 10th most loved language, despite being the 16th most used one, suggests that devs using it really appreciate how well it works.
One interesting finding is that no language has a “highly negative” rating, meaning that none have received significantly more “negative” mentions than positive ones. To me, this suggests that popular languages these days are all pretty good: after all, a poorly designed language won’t win much adoption.
4. Most-loved (and hated) tools
We gathered details on the most-loved and most disliked tools, similarly to what we did for programming languages. We counted all positive and negative mentions, and then deducted the negatives from the positives:
Most-loved tools
The presence of so many IDes and text editors on this list, such as VS Code, JetBrains, Cursor, Neovim, Vim, Zed, and Emacs, indicates that engineers spend a good part of their days inside the editor.
JetBrains products get plenty of love by garnering nearly as many mentions as VS Code, which shows JetBrains know what they’re doing.
Cursor being the third-most loved product is a standout achievement, especially because the product is barely two years old. We recently did a deepdive into how Cursor is built, with cofounder Sualeh Asif.
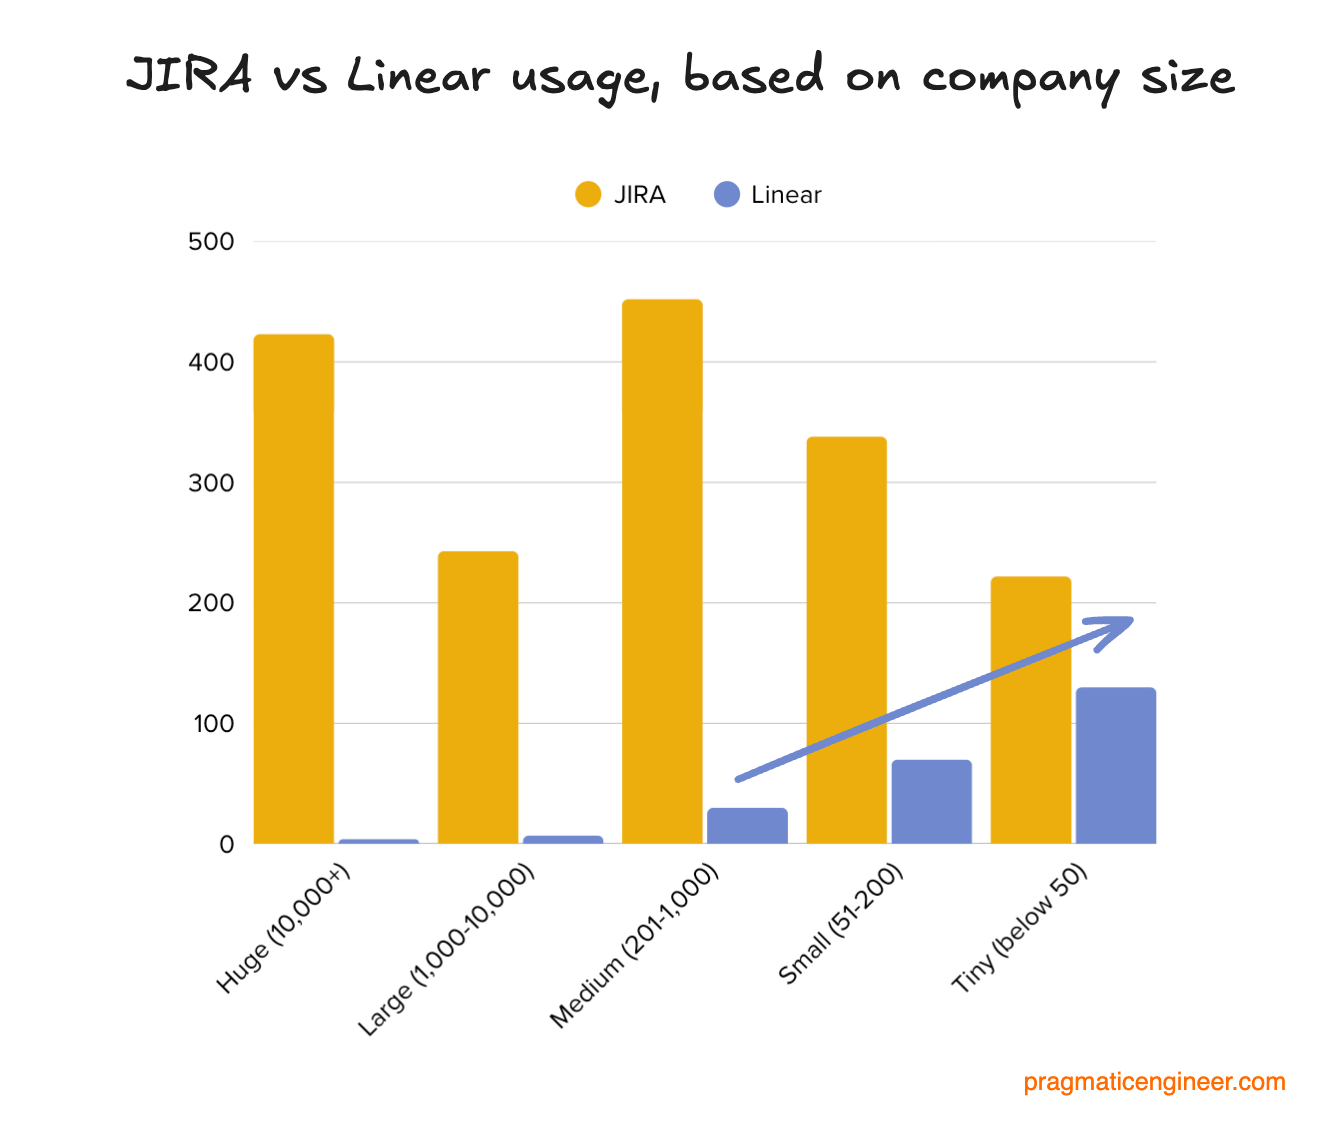
Linear is mentioned positively mostly in comparison to JIRA (see below), for being a snappier experience, and more pleasant to use than Atlassian’s flagship product. We also did a deepdive Inside Linear’s engineering culture, and a podcast episode on How Linear moves so fast.
Expo is the only framework to make it to this “most-loved” list. It is a cross-platform mobile development library and we previously did a deepdive on Expo, covering plenty of details.
Most-disliked tools
JIRA is by far the most-disliked tool among respondents, with more negative mentions than the next four tools combined! For example, many mentions of Linear were in the context of devs wishing they could use this more lightweight tool instead of JIRA. Chief complaints about JIRA are that it’s slow, complex, and cumbersome.
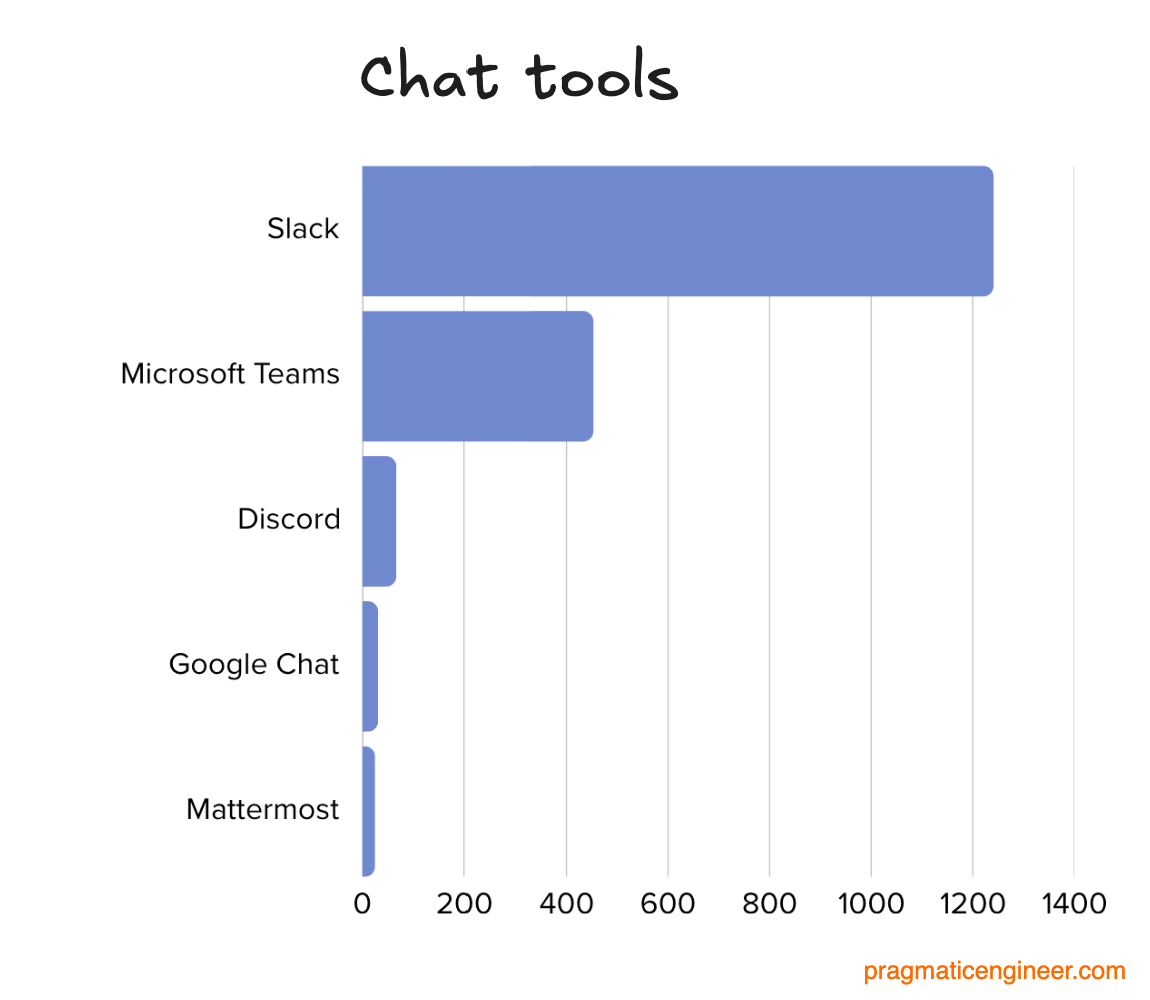
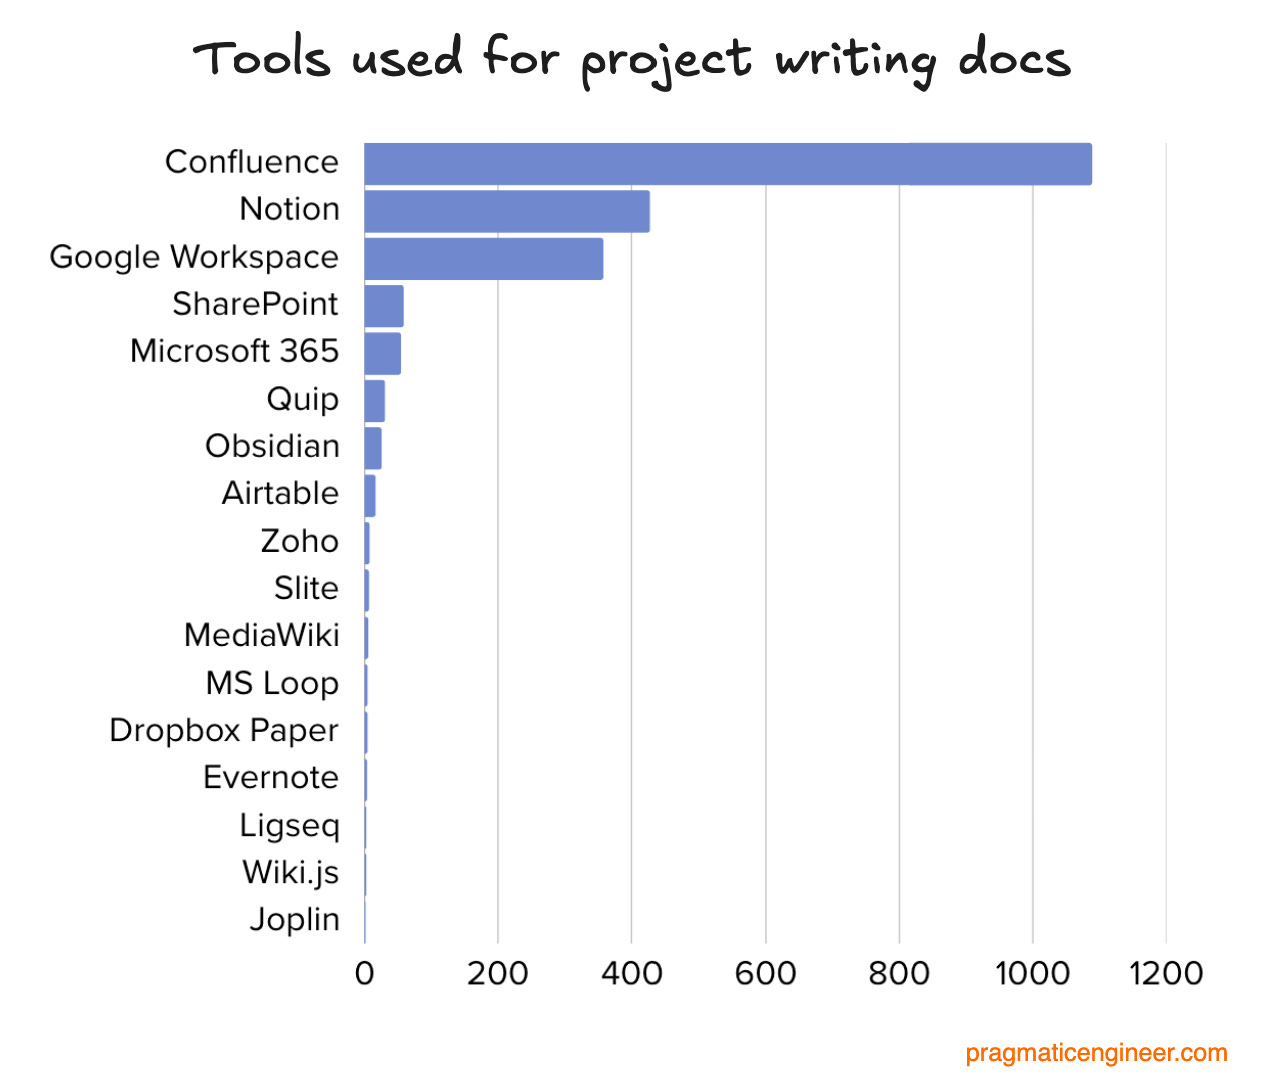
Linear is the most frequently-mentioned replacement for JIRA. Slack is often mentioned as the tool devs currently using Microsoft Teams say they wish they could use, instead. Coda (a document collaboration platform) is often mentioned as what devs would like to replace Confluence (Atlassian’s team collaboration and knowledge management platform) with.
Reasons for disliking tools
Factors which developers mention for disliking something:
There are some obvious themes in why devs dislike tools:
Slowness! The single biggest complaint about JIRA, Confluence, and other tools that devs criticize.
Bugs and crashing. A telling description by a dev of why they dislike MS Teams: “Lack of custom emojis, buggy, and crashes frequently, split chat and teams, the list goes on and on.”
Redesigning the UX. One respondent on a feature flagging vendor: “it used to be good but I despise the redesigned interface. Beyond basic usability issues, the redesign makes it much easier to apply changes to the wrong environment by mistake.”
Complicated, or too “heavy.” This is a common criticism of frontend frameworks. As one engineer summarizes: “Most frontend technologies are too complex [and] have too many dependencies. Usually just too complicated to deal with for what the client really needs.”
5. IDEs and Terminals IDEs
The most popular by number of mentions:
Commonly-mentioned IDEs by respondents
Cursor being the second most-used IDE is very surprising, given it’s been around for only two years!
JetBrains has seven IDEs in the above list: IntelliJ (tailored for Kotlin and Java), Rider (.NET), Webstorm (web), PHPStorm (PHP), Goland (Go), Datagrip (data), and RubyMine (Ruby). Additionally, they also have CLion (C/C++) and RustRover (Rust), which were mentioned 10 and 8 times, respectively. If we combine the two Microsoft IDE mentions (VS Code and Visual Studio) and these seven IntelliJ IDEs, this is the split:
Split between Microsoft and JetBrains IDEs (3,131 mentions. Respondents could name more than one tool per response.) Terminals
Terminals mentioned:
Neovim: an extensible, Vim-based editor
Bash (the Unix / Linux shell)
Vim: an editor part of most Unix / Linux systems
Emacs: an extensible and customizable editor
Warp: a terminal enhanced with AI
Zsh: a Unix shell and command-line interpreter
Tmux: a terminal multiplexer for Unix
Ghostty: a fast and feature-rich terminal
iTerm2: a “replacement for Terminal” on Mac
6. Version control, CI/CD
Which tools do devs use for version control, continuous integration (CI), and continuous deployment (CD)? Here’s what the survey says:
Version control
78% of respondents mention some kind of version control – almost all being a variant of Git.
Here is the split of vendor mentions:
Version control tools mentioned across all responses
In the “Other” category, the mentions are:
SVN (18 responses, 0.6%)
TFS (10, 0.3%)
Perforce (8, 0.25%)
Mercurial SCM (6, 0.2%)
If we zoom into Git vendors, we see:
Version control responses mentioning Git vendors (2,311 responses)
GitLab and BitBucket are alive and well – and this survey is a reminder of that. For some reason, I assumed GitHub would absolutely dominate this category, and that it would have a market share of close to 90%. And this is potentially true for hobby projects, but most respondents share their work stack.
In the Stack Overflow 2022 survey, we saw similar results among professional developers:
GitHub, GitLab, and Bitbucket results are similar to those in our Stack Overflow survey of 2022
GitLab’s self-hosted offering still seems popular. Around 10% of GitLab mentions are for GitLab’s self-hosted offering, and it seems to be the last major Git provider offering self hosting.
CI/CD
In the category of continuous integration and continuous deployment, the results are:
Most-mentioned CI/CD solutions
GitHub Actions being the most-used continuous integration (CI) tool by so much is somewhat surprising. GitHub Actions launched as generally available (GA) in 2019, but many other vendors in this list have been around much longer. That GitLab CI and Bitbucket Pipelines are popular is less surprising because both are offerings from GitHub, GitLab, and Atlassian (the vendor behind Bitbucket). It seems that many customers prefer to use the CI/CD offering from the same company as they use for version control.
Vendors mentioned:
GitHub Actions: CI/CD and build automation by GitHub
Jenkins: the leading open source build server
Azure DevOps: Microsoft’s offering, which includes CI/CD
CircleCI: a popular CI/CD tool
Argo CD: continuous deployment for Kubernetes
Travis CI: another CI/CD tool, and competitor to CircleCI
Bitbucket Pipelines: the CI/CD offering of Atlassian
Teamcity: CI/CD service from JetBrains
Buildkite: run CI/CD on your own infrastructure, as used by large companies like Uber, Slack, Canva and others
Gradle: CI/CD for Android, Java and Kotlin. Open source
Bazel: a build tool open sourced by Google. It performs well with large codebases
Octopus Deploy: CI/CD for Kubernetes and other platforms. Built for scale
NX: an “AI-first” build platform
Bitrise: CI/CD for anything mobile (native iOS/Android, React Native, Flutter, Cordova, Ionic, Unity. We covered more about many of these technologies in Cross-platform mobile development)
Honorable mentions:
Harness: continuous delivery
Atlassian Bamboo: Atlassian’s self-hosted CI/CD platform
Spinnaker: mutli-cloud continuous delivery
Tekton: cloud-native CI/CD
In-house solutions are also a thing for CI/CD. Many of the Jenkins mentions refer to companies running their own Jenkins setup. Also, larger companies like Google, Meta, and Uber, have custom-build CI/CD systems, and often use custom feature flag systems that might be integrated with CI/CD systems, in-house experimentation stack, and lots of custom infrastructure, in general.
7. Cloud providers, PaaS, IaaS
Here is how backend providers lines up, based on survey responses:
Split of backend provider mentions across all respondents (2,866 responses)
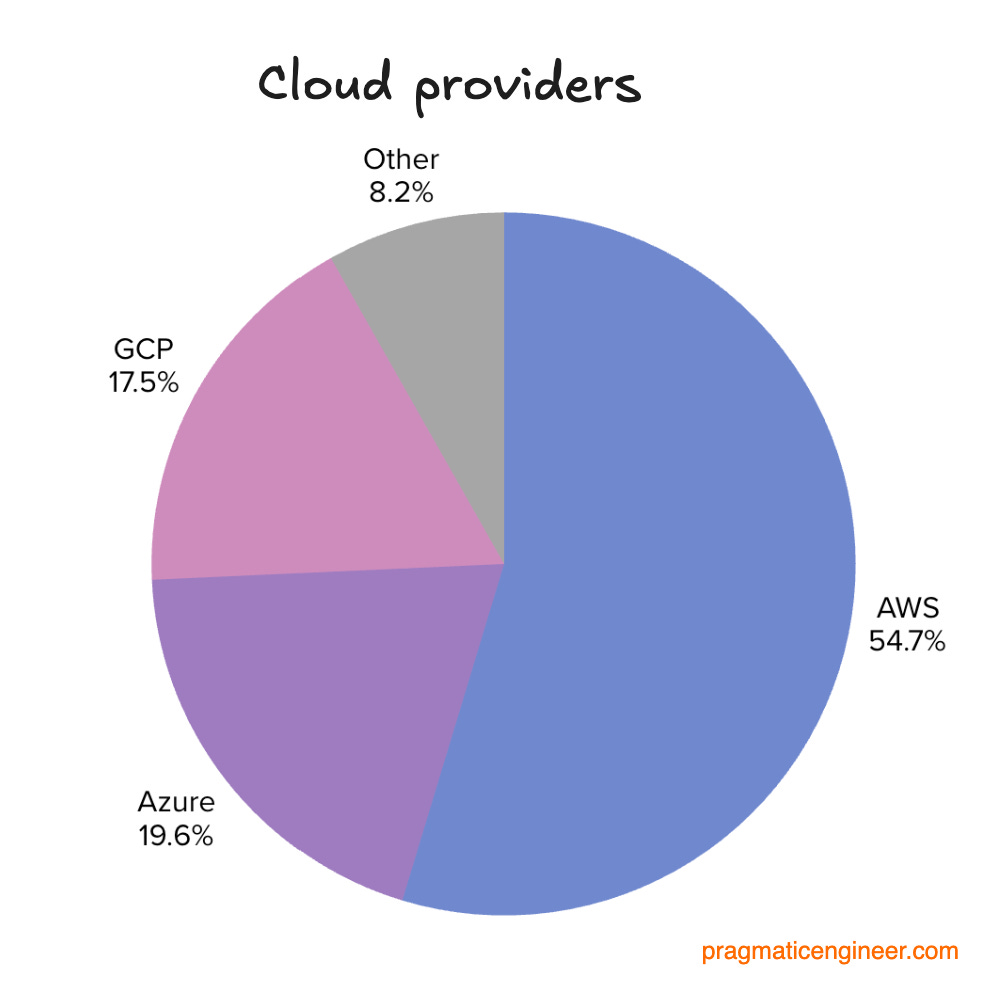
Zooming in on mentions of the three largest cloud providers (AWS, Azure, GCP):
Split of cloud provider mentions across the “Big 3” clouds (2,631 mentions)
Interestingly, VC firm Coatue estimates that total revenue in the cloud market splits like this:
AWS: 44%
Azure: 30%
GCP 19%
The difference in numbers suggests our survey results are likely to overrepresent AWS and underrepresent Azure. I’d speculate that Azure is more popular at “traditional” companies, while Pragmatic Engineer readers tend toward Big Tech workplaces and startups.
Looking deeper, here are smaller cloud providers and platform-as-a-service (PaaS), or infrastructure-as-a-service (IaaS), mentions:
Other infrastructure providers mentioned
Vercel is the clear leader in infrastructure choice beyond the “Big 3”. By comparison, Vercel has one fifth of the mentions that GCP gets (100 vs 502).
Details about other providers:
Vercel: a PaaS optimized for web applications. Founded in 2015, it raised $563M in funding. Vercel is the creator of the popular Next.js React framework, and the Vercel v0 “vibe coding” tool.
Heroku: a PaaS that used to be very popular in the early 2010s. Founded in 2007, Salesforce acquired Heroku in 2010 for $212M.
Hetzner: IaaS provider headquartered in Germany. Offers VPSes (virtual private servers). Known for affordable pricing. The company was founded in 1997, never took VC funding, and remains a private company, making it one of the larger bootstrapped companies.
Render: a PaaS scaleup. Founded in 2018, the scaleup has raised $157M from VCs since. In January this year, the company shared that more than 2 million developers use its platform.
DigitalOcean: an IaaS provider where you can spin up VPSes (called “Droplets” in DigitalOcean lingo). The company is publicly traded, valued at $2.5B.
Netlify: a PaaS with strong support for frontend projects. Founded in 2014, the scaleup raised $212M in funding.
Fly.io: somewhere between a PaaS and an IaaS. Fly.io abstracts away most infrastructure management, allowing deploying applications as Docker containers (where the platform takes care of scaling). It also offers “Fly Machines” (microVMs) where customers have more control over regions and instances, which is similar to what IaaS providers offer. Founded in 2016, the startup has raised $110M.
Railway: a PaaS scaleup. Founded in 2020, the company raised $25M in funding. By 2023, the company already had more than 300,000 users(!)
Takeaways
This tech stack survey has been the biggest piece of reader-based research to date by the Pragmatic Engineer, and I hope you find the results interesting! We certainly do. Here are my biggest takeaways:
Us devs are not shy to try out new tools in innovative areas. AI tools are a model example of how quickly things can change in just a year. Twelve months ago, GitHub Copilot seemed to dominate this category, but since then, smaller startups have gained mindshare and market share. This explains why VC investors are pouring so much money into areas seen as innovative: it’s still easy enough to have developers try out new tools, and perhaps stick with them!
In 2025, AI dev tools are the hotbed of innovation, and in the AI tooling category, companies founded only 2-3 years ago can already be leaders, like Cursor is – at least for now.
In more established categories, change is slower. In areas like programming languages and CI/CD systems – where each language has been around 10+ years or more – it’s harder for new startups to gain customers and make the kind of “splash” Cursor has.
JetBrains taking on Microsoft in IDEs is a remarkable highlight. Microsoft is a Big Tech giant with developer tools in its DNA: it’s been a major focus of the company for 50 years. And yet, JetBrains keeps being a strong competitor to it in IDEs, and is one of the most loved tools – right behind VS Code.
Do devs dislike JIRA, or just hate being micromanaged? For as long as I’ve been a dev, I’ve seen fellow developers getting mad at JIRA because it’s slow, clunky, not customizable enough, etc. Another big reason is that we just don’t like being pushed to use it! That “push” has always come from product managers, project managers, or some other kind of manager.
But I wonder if the root problem is really with JIRA itself, or whether any project management tool idolized by managers would encounter the same push back? It is rare to find a dev who loves creating and updating tickets, and writing documentation. Those who do tend to develop into PMs or TPMs (Technical Program Managers), and do more of “higher-level”, organizational work, and less of the coding. Perhaps this in turn makes them biased to something like JIRA?
We hope you get some value from this article about tools devs use in 2025. We intend to follow up with some more findings from this survey in a few weeks’ time. In the meantime, please leave a comment below if you have any thoughts about the state of tooling today. Thanks again to everyone who took the time to be part of this survey.
Updates to the article on 16 July, after reader feedback (thank you!)
Added PHP and Clojure as languages (how could I miss a popular language like PHP - my apologies!)
Added Replit and Raycast to the list of AI tools
Added a section on GitHub Copilot possibly being underrepresented on social media


